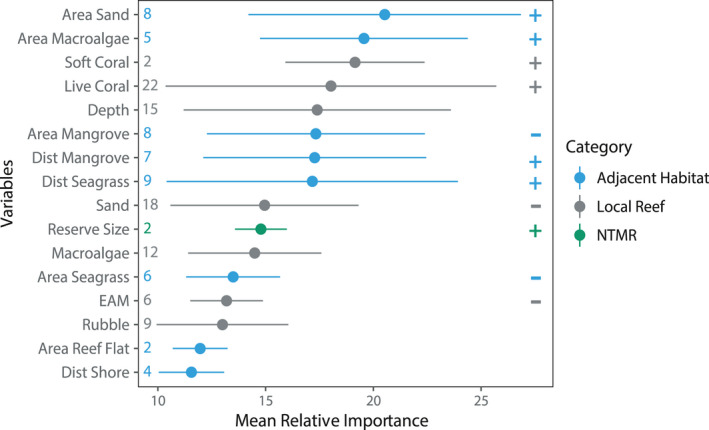
Figure 3.

Mean relative importance of variables with high influence (>10% relative importance) across all 32 reef fish models analyzed for density, biomass, and presence of coral reef fish. Dots represent means, and bars represent upper and lower standard deviation. Colors indicate the scale category for adjacent habitat (blue), local reef (gray), or no‐take marine reserve (green). Values on the left‐hand side of the graph represent the number of times that variable was used in a model, and symbols (+ or −) on the right‐hand side indicate the direction of the relationship when obvious
