
Figure 3. Fatty Acids (FAs) Derived from TDEs Induce Intracellular Lipid Accumulation in DCs.
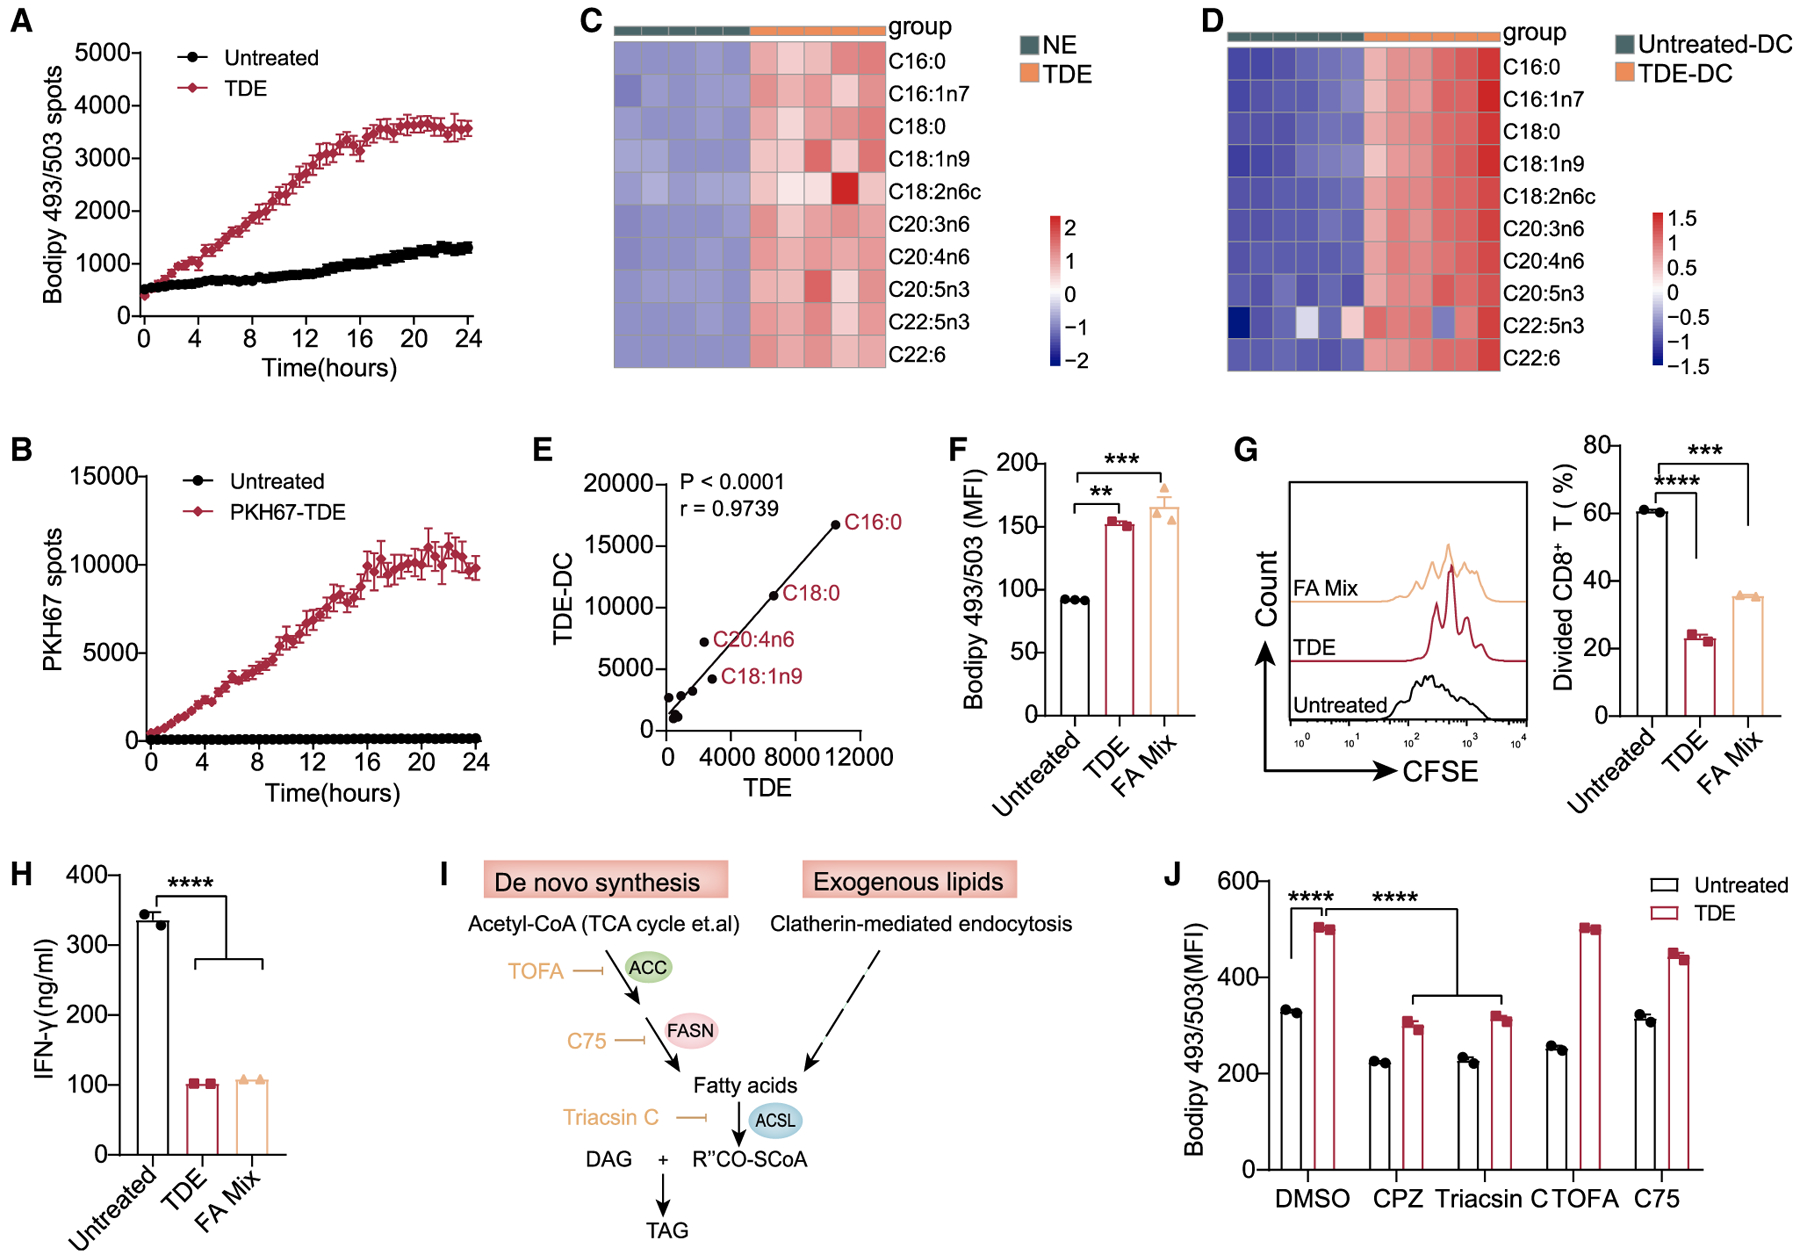
(A) The real-time intracellular lipid content change was detected by Bodipy 493/503 and recorded every 30 min by Opera Phenix High Content Screening System (also shown in Video S1).
(B) The uptake of TDEs was indicated by PKH67 and recorded every 30 min by Opera Phenix High Content Screening System (also shown in Video S2).
(C) Lipidomics analysis of TDEs and NEs.
(D) Lipidomics analysis of BMDCs cultured with or without TDEs (400 μg/mL) for 48 h.
(E) Correlation analysis of FAs between TDEs and TDE-treated DCs.
(F) Intracellular lipid levels in BMDCs treated with TDEs (400 μg/mL) or with FA mix (C16:0 30 μM, C18:0 15 μM, C18:1n9 15 μM, and C20:4n6 20 μM) for 24 h.
(G and H) Proliferation (G) and IFN-γ production (H) of CD8+ T were analyzed.
(I) Schematic diagram showing the triglyceride synthesis. ACC, acetyl-CoA carboxylase; ACSL, long-chain acyl-CoA synthetase; DAG, diacylglycerol; FASN, FA synthase; TAG, triglyceride.
(J) Intracellular lipid levels in BMDCs cultured with or without TDEs (400 μg/mL) for 24 h in the presence of DMSO, chloropromazine (CPZ) (40 μM), triacsin C (15 μM), TOFA (5 μg/mL), and C75 (30 μM).
**p < 0.01; ***p < 0.001; ****p < 0.0001. (J) was analyzed with 2-way ANOVA. Other data were analyzed with 1-way ANOVA. The error bars represent SEMs. The error bars of (H) represents SDs. Representative of 3 independent experiments in (F)–(H), and (J).
See also Figure S3.