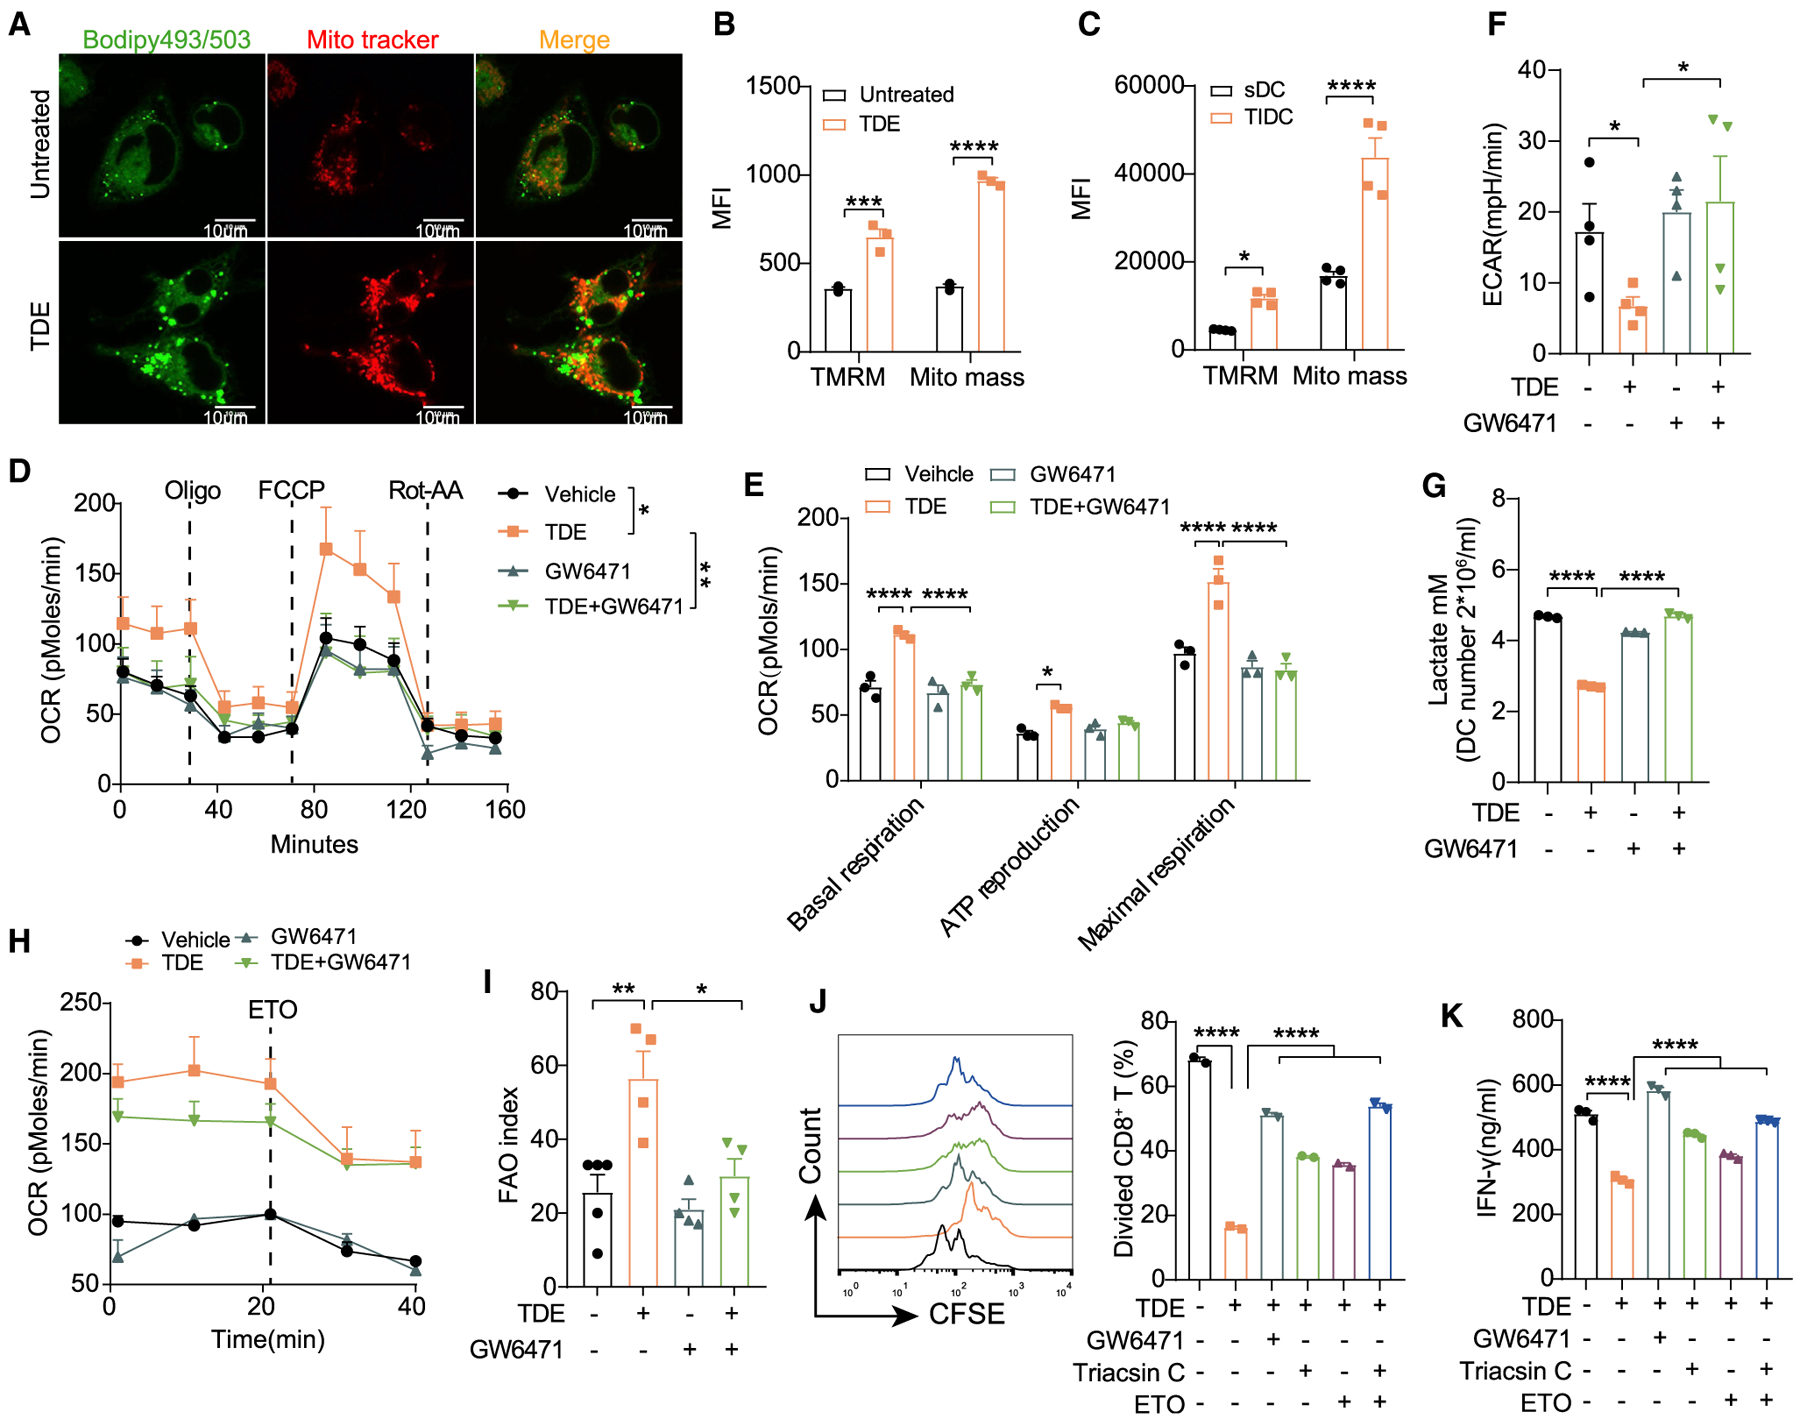
Figure 5. PPARα Activation Reprograms the Lipid Metabolism of DCs.

(A) Representative confocal images show the intracellular lipid level and mitochondrial mass of BMDCs treated with or without 400 μg/mL TDEs for 24 h. Scale bar, 10 μm.
(B and C) Mitochondrial membrane potential (TMRM) and mitochondria mass were analyzed in BMDCs treated with or without 400 μg/mL TDEs (B), and sDCs versus TIDCs from MC38-OTI tumor-bearing mice (C).
(D–F) BMDCs pre-treated with or without TDEs (400 μg/mL) in the presence or absence of GW6471 (15 μM) for 48 h; the OCR (D) and ECAR (F) were recorded. The basal respiration, ATP reproduction, and maximal respiration (E) were calculated based on the data in (D). TDE + GW6471 indicates BMDCs treated with TDEs and GW6471.
(G) BMDCs were treated as in (D), and the lactate production was measured.
(H) BMDCs were treated as in (D), and the FAO activity in BMDCs was recorded.
(I) The amount of OCR derived from FAO was quantified as the response of BMDCs to ETO (Etomoxir) treatment.
(J and K) BMDCs were treated with 2 mg/mL OVA in the presence or absence of TDEs (400 μg/mL) plus GW6471 (15 μM), Tracsin C (15 μM) or ETO (40 μM) for 48 h, followed by antigen removal and co-culture with OT I CD8+ T cells for another 3 days. Proliferation (J) and IFN-γ production (K) of OT I CD8+ T cells were analyzed.
*p < 0.05; **p < 0.01; ***p < 0.001; ****p < 0.0001. (B)–(E) were analyzed with 2-way ANOVA. Other data were analyzed with 1-way ANOVA. The error bars represent SEMs. The error bars of (G) and (K) represent SDs. Representative of 3 independent experiments in (D)–(F) and 2 independent experiments in (B), (C), (G), (H), (J), and (K).
See also Figure S5.
