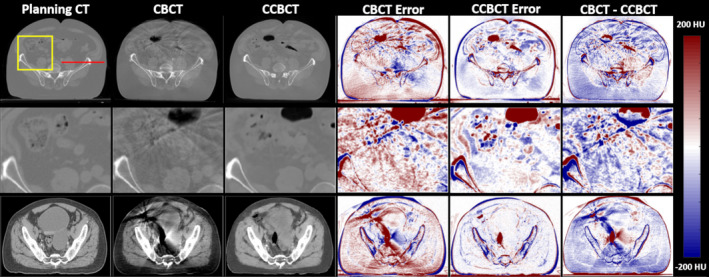
Figure 5.

Cone‐beam computed tomography (CBCT) correction results on two sets of pelvis patient data. The first column shows various views of the planning CT images, the second column shows corresponding views of the original CBCT image, the third column shows the corrected CBCT image, the fourth and fifth columns show the CBCT error and CCBCT error, and the final column shows the difference between the CBCT and CCBCT images, respectively. The CT images and inserts in the first two rows are shown on a window of [−1000 1000] HU, the final row of CT images and the error images are both shown on a window of [−200 200] HU. [Color figure can be viewed at wileyonlinelibrary.com]
