Figure 2.

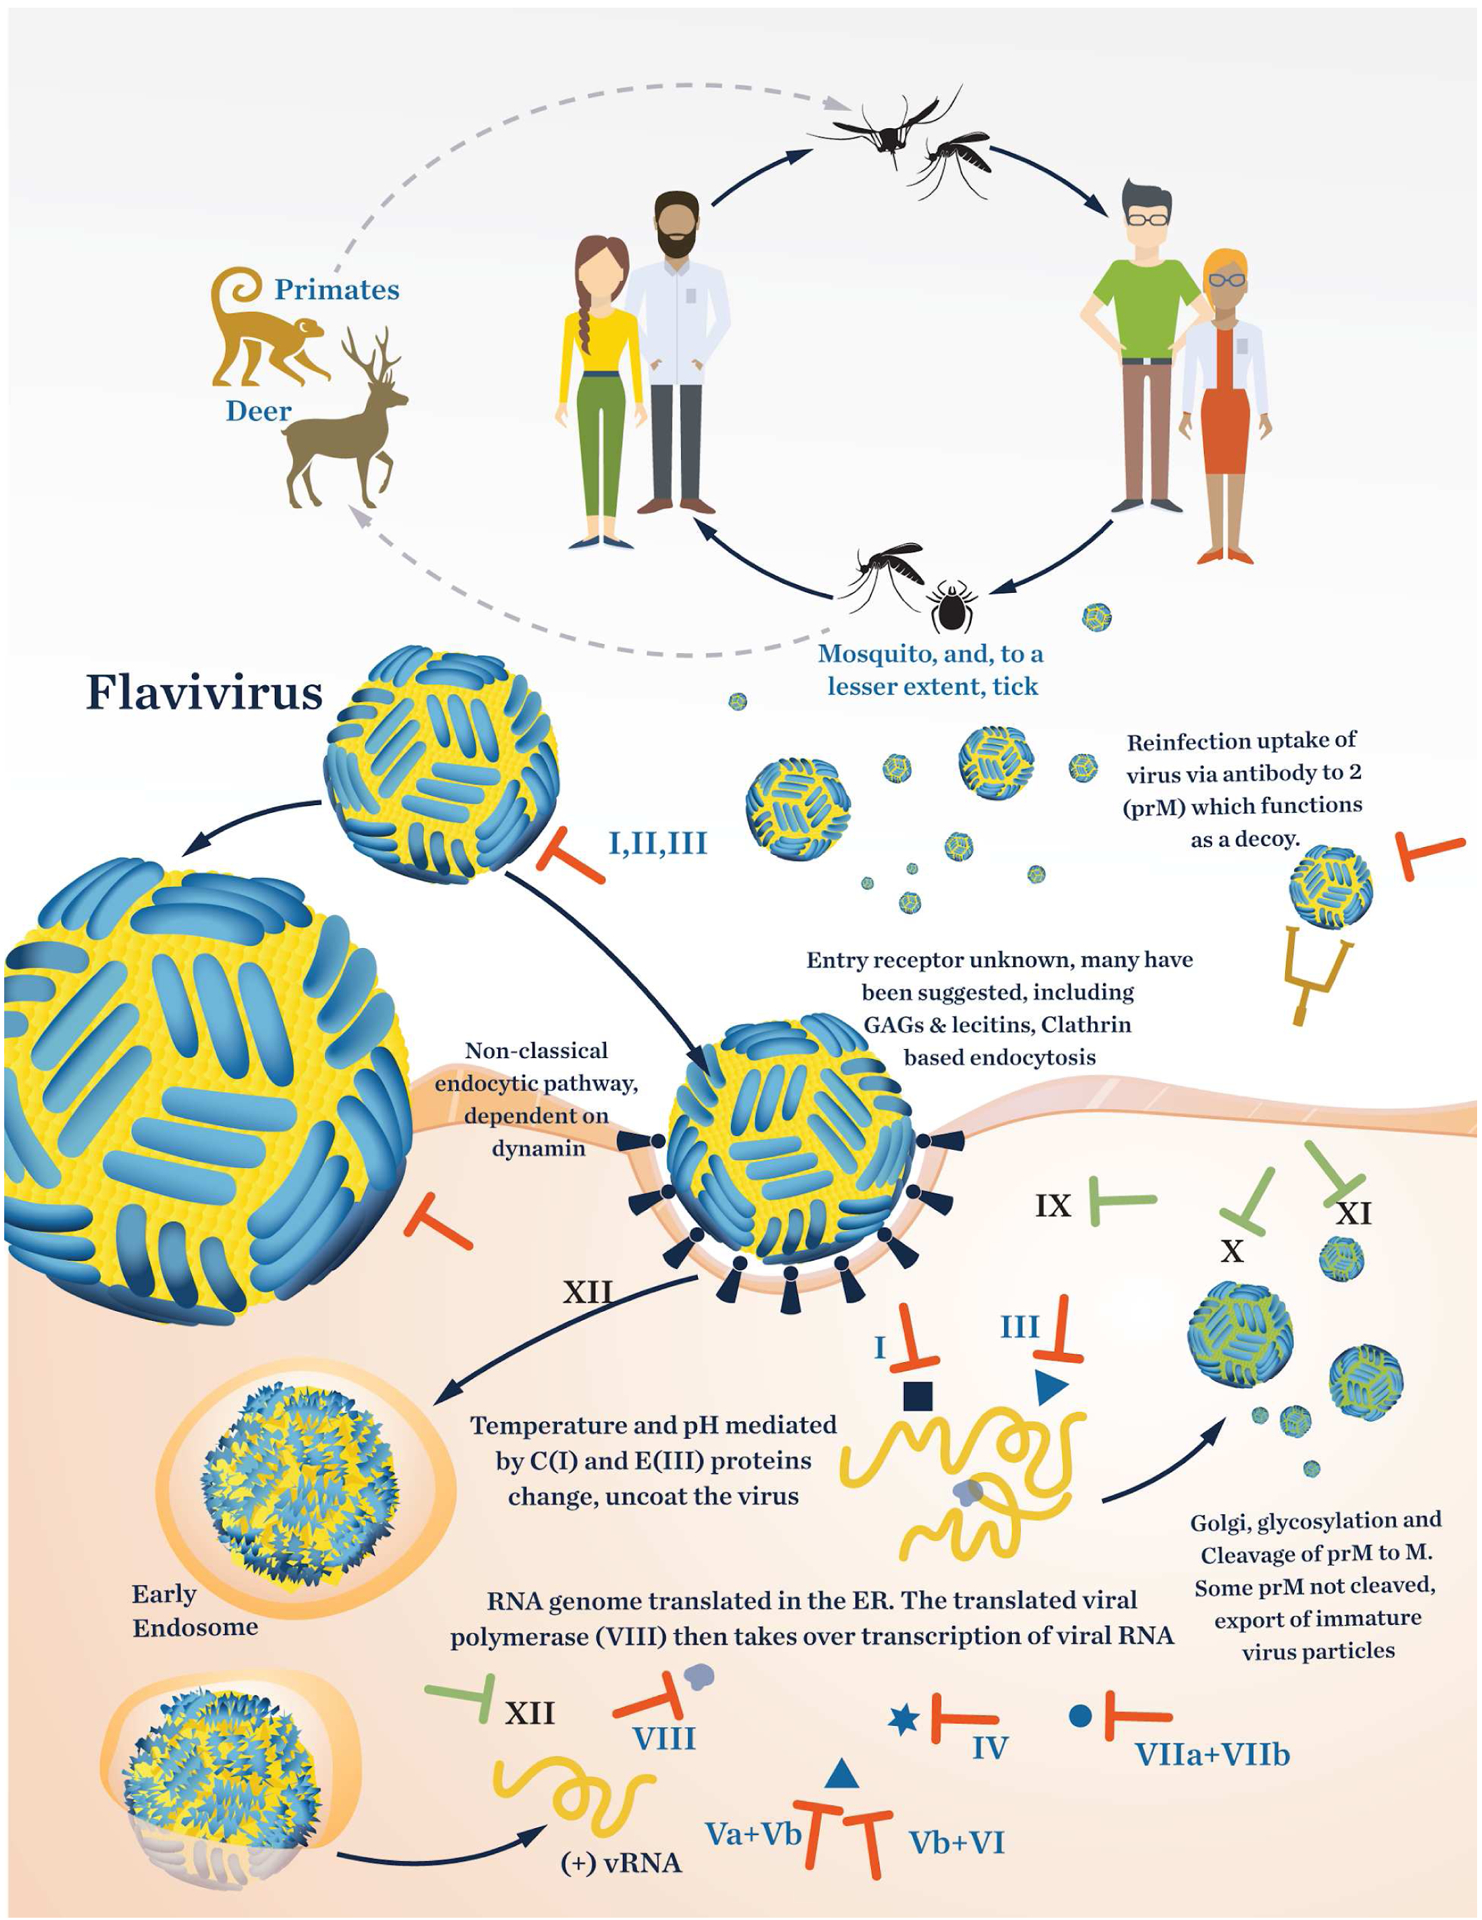
Life cycle of Flaviviridae as represented by the dengue virus. The roman numerals in the figure refer to entries in Table 3. The “T” symbol indicates a target with potential for developing an inhibitor.

Life cycle of Flaviviridae as represented by the dengue virus. The roman numerals in the figure refer to entries in Table 3. The “T” symbol indicates a target with potential for developing an inhibitor.