Fig. 3.

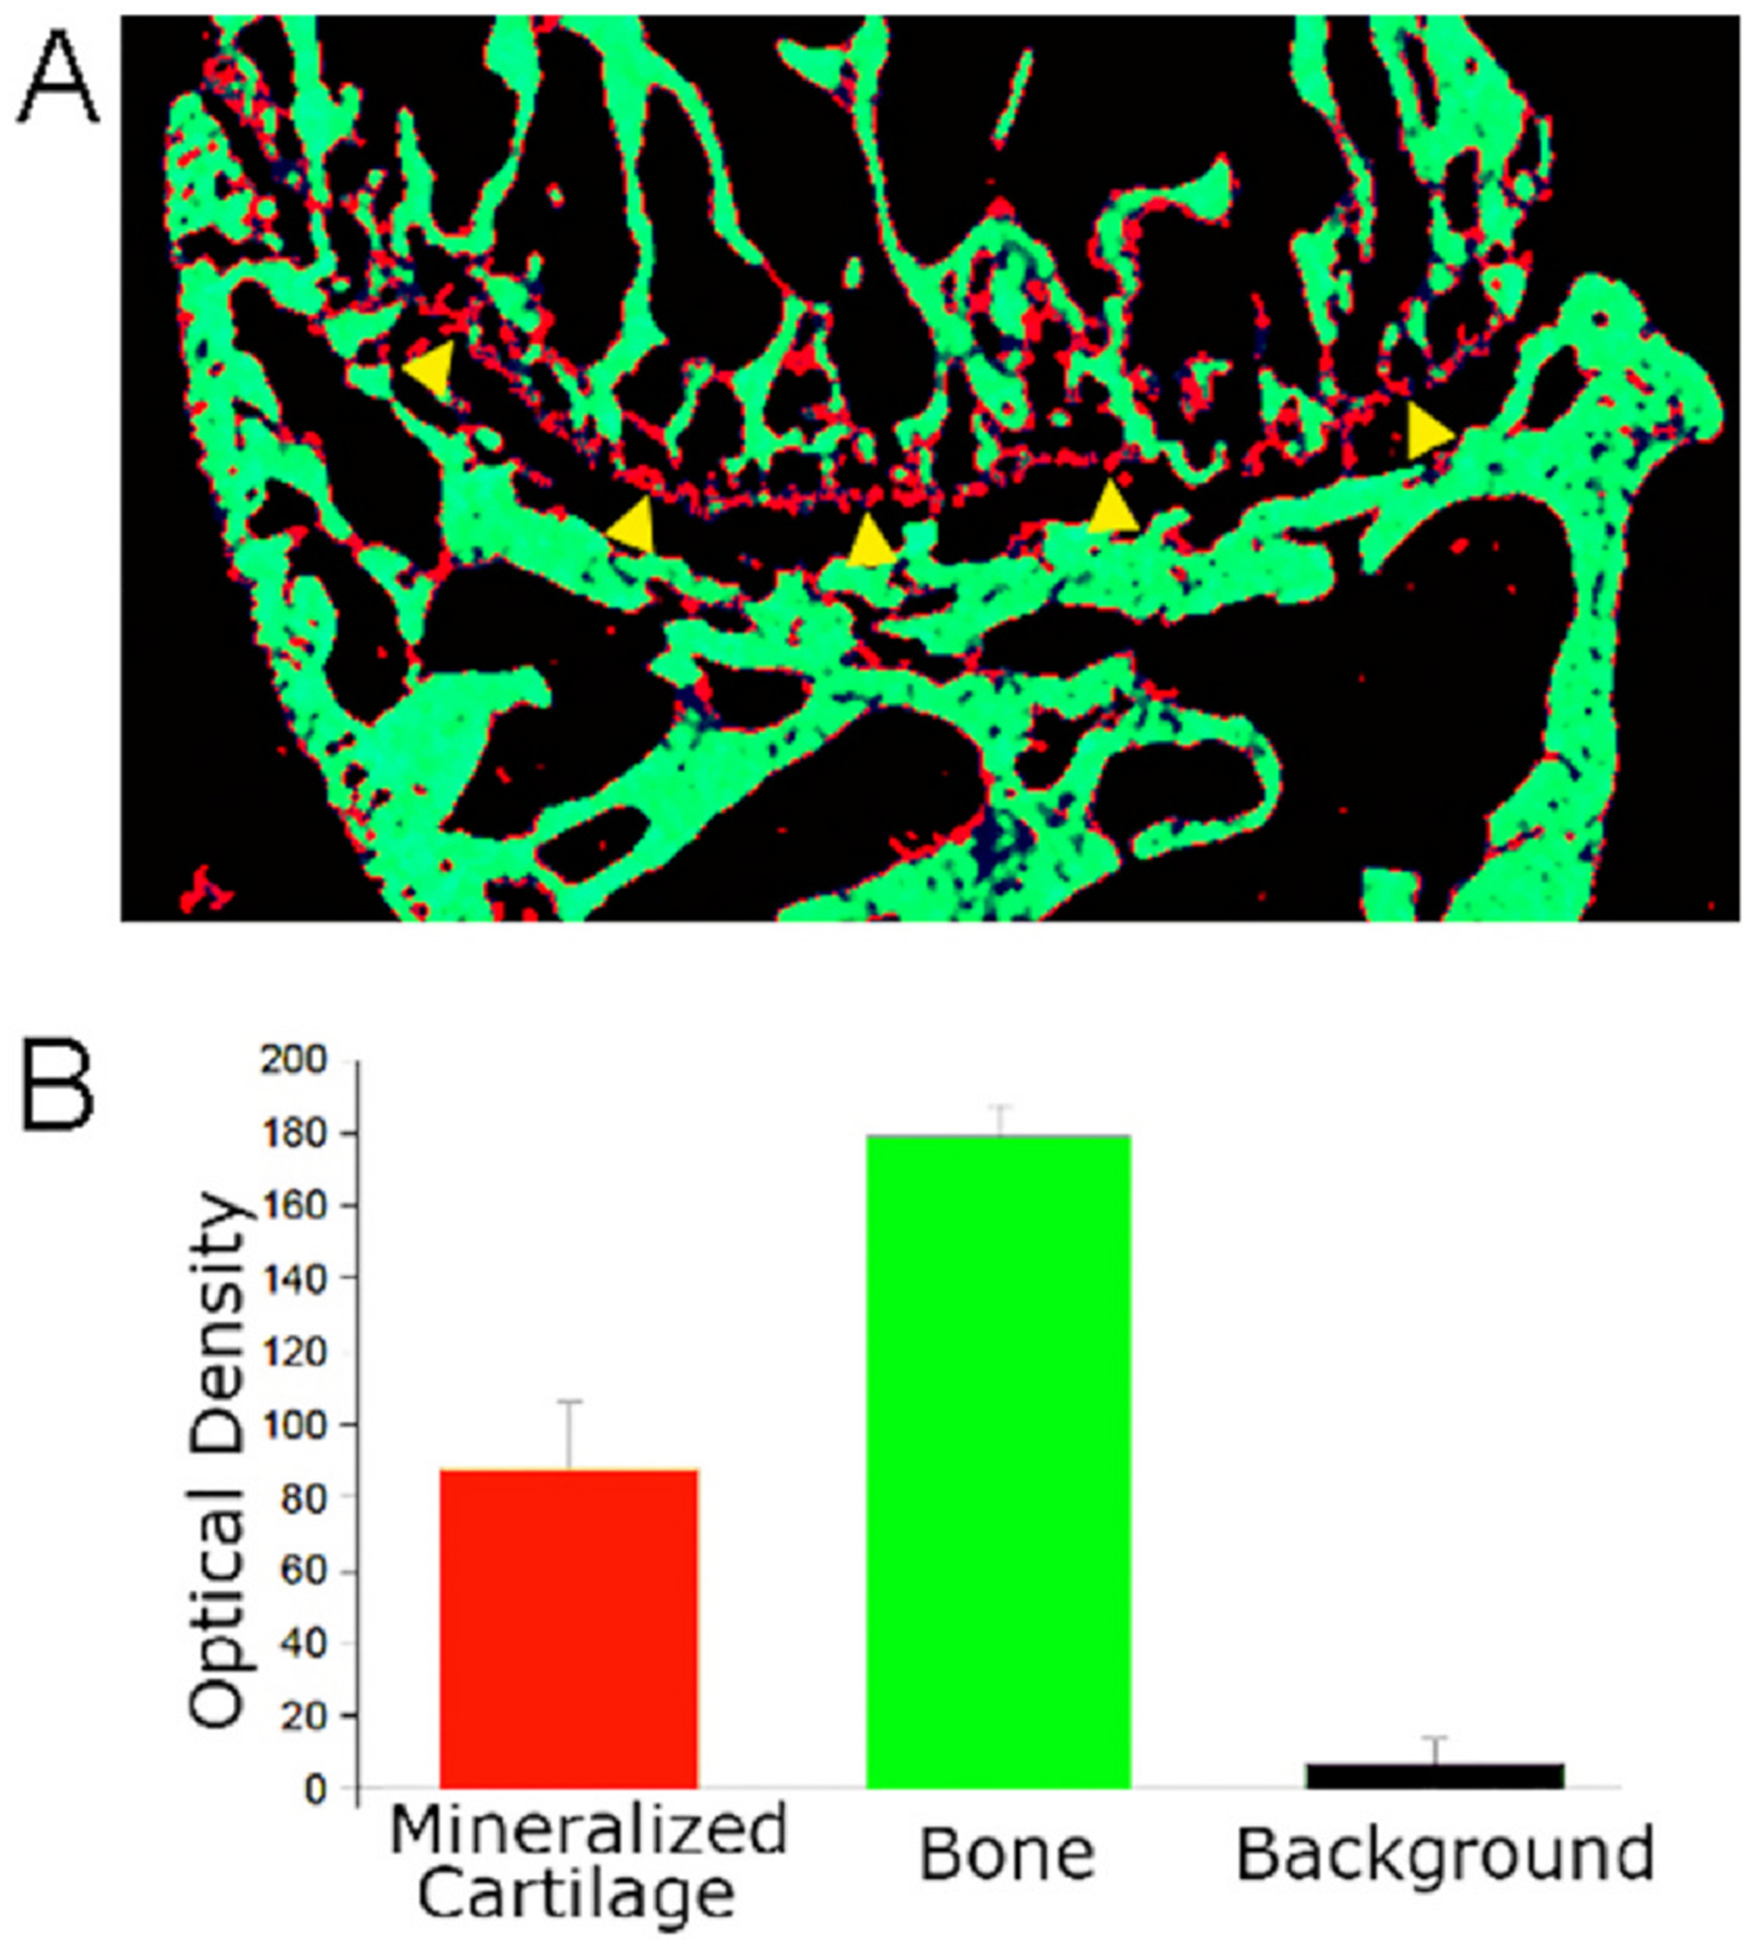
Comparison of Cartilage and Bone Mineral Density. Unpublished photographs from [11]; mouse sections and density are of wild type mice, as in Fig. 1.
A. Micro-computed tomography of a mouse femur tibial end. The pixels are color coded for density of < 10, black, 10–100, red, and > 100, green. Note the mineralized cartilage is seen as a red line (marked by yellow arrowheads at its bottom; compare with Fig. 2A, lower panel).
B. Density of mineralized cartilage, bone, and background from micro computed tomography as in (A). N = 4, mean ± SD. The cartilage has approximately half the density of bone; the difference is significant, p < 0.001. This difference in cartilage and bone mineral density reflects, in major part, that cartilage is not vascular, and in addition to having a lower mineral density than bone, cartilage has more variable mineral composition [39], see text.
