
FIGURE 1.
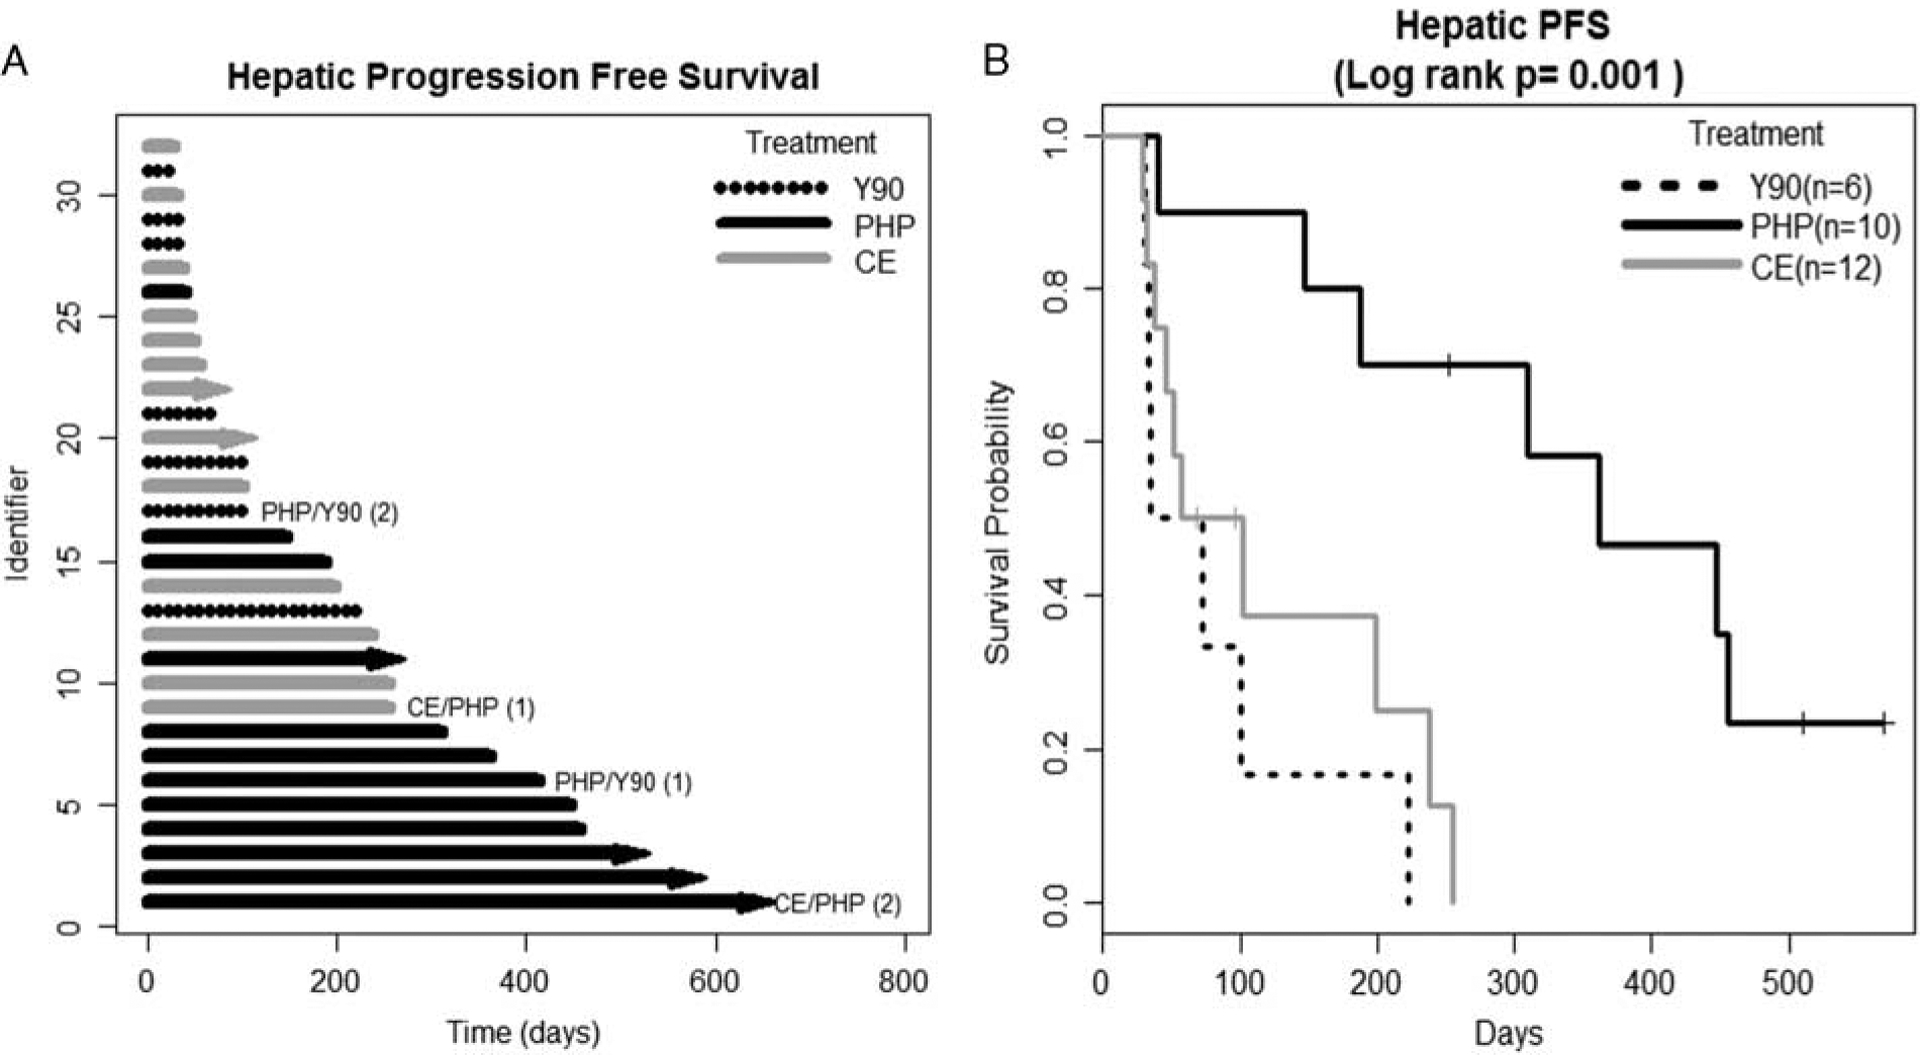
Hepatic progression free survival (HPFS). A, Swimmer’s plot. Lines with arrows represent ongoing HPFS, lines without arrows indicate that patient was censored due to progression, lost to follow-up or death. B, The Kaplan-Meier survival curve. Patients undergoing 2 forms of liver-directed therapy were removed from the Kaplan-Meier survival analysis. CE indicates chemoembolization; PHP, percutaneous hepatic perfusion; Y90, yttrium-90.