
Figure 3: Clinical activity of cemiplimab and tumour mutational burden.
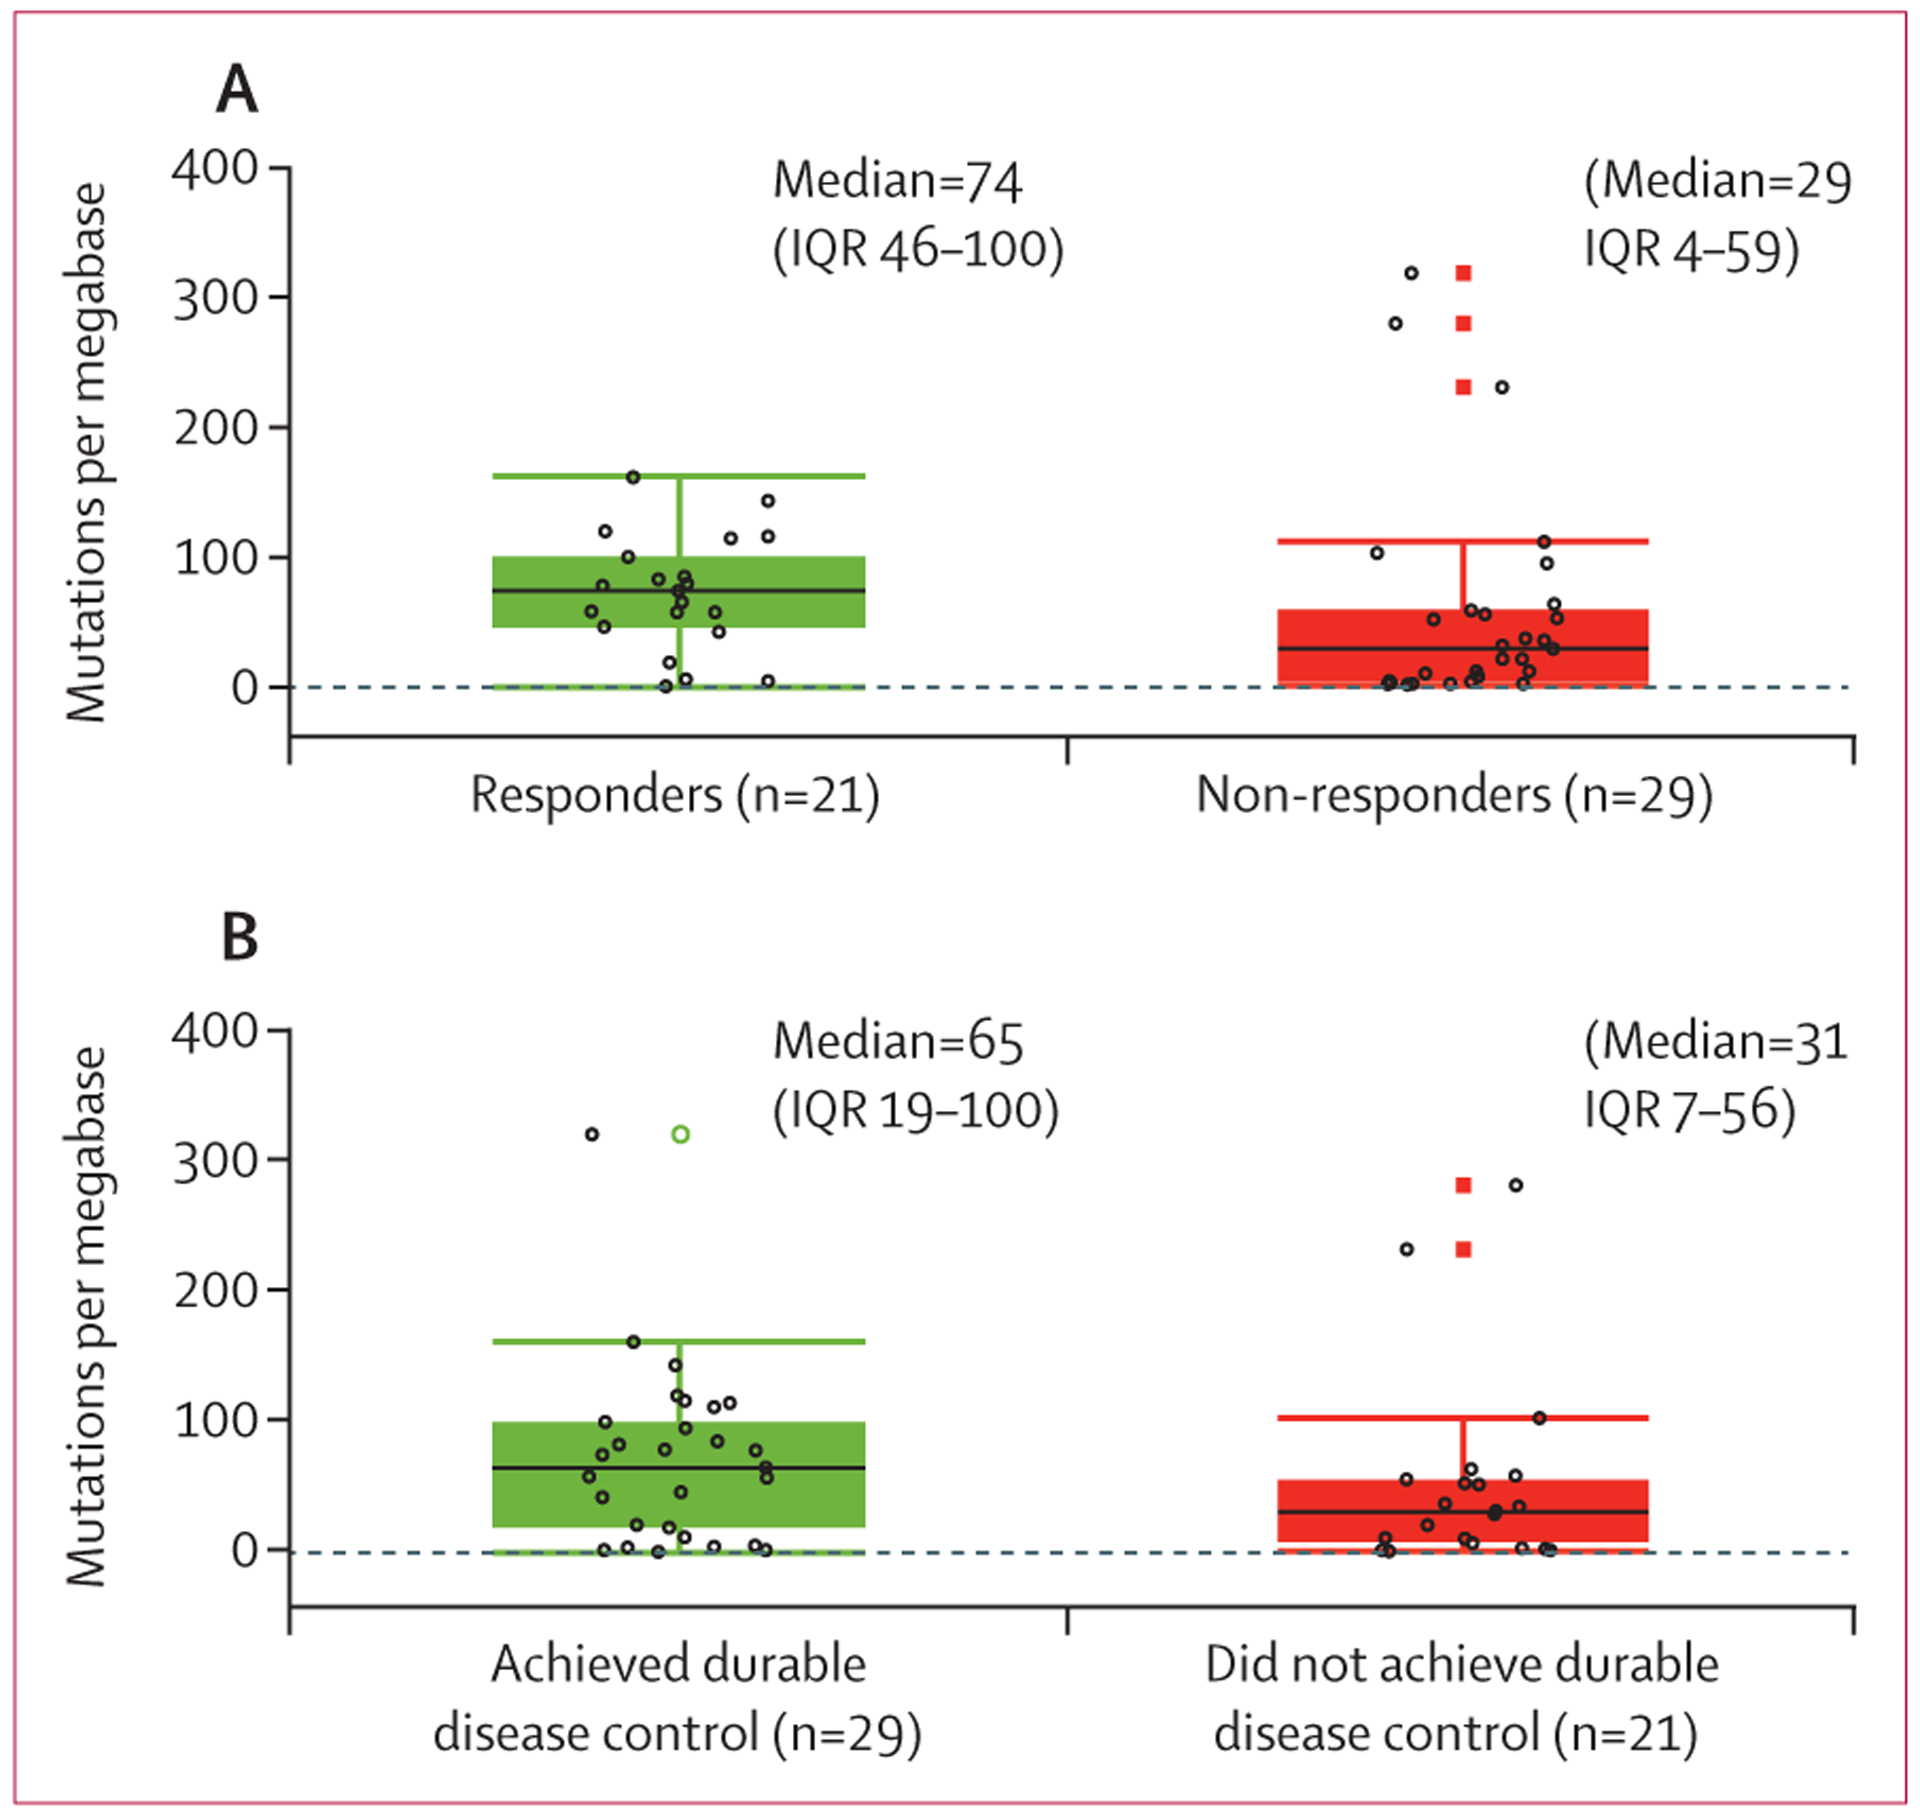
(A) Tumour mutational burden for responders (complete or partial response) versus non-responders (stable disease, progressive disease, or not evaluable) as per independent central review. (B) Tumour mutational burden for patients who achieved durable disease control (patients without progressive disease for at least 105 days) versus those who did not. Black lines in each box denote the median; lower and upper boundaries of box denote the IQR; and upper and lower whiskers indicate maximum and minimum values. Individual patients are indicated by open black circles. Open black circles beyond the whiskers are outliers. Open green circles and closed red boxes are duplicates of the outliers (the plots overlap box plots and scatter plots).