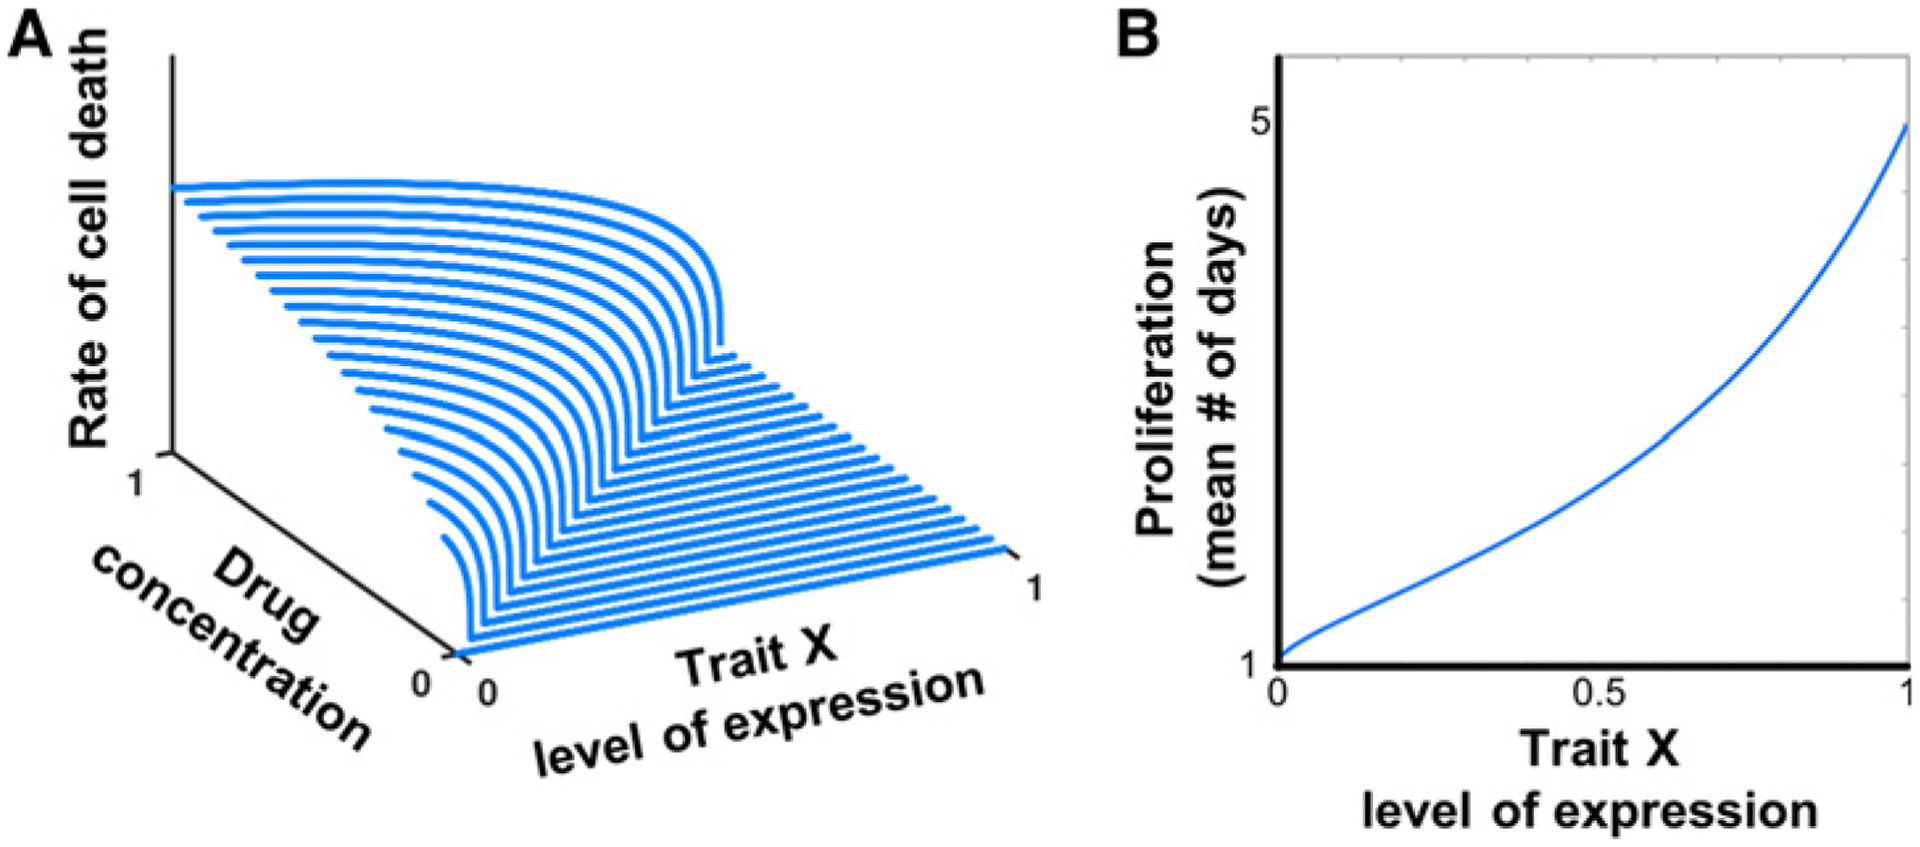
Figure 2.

The tumor cell population is assumed to be genetically and phenotypically heterogeneous in the level of expression of trait x (see Materials and Methods). Depicted in A is the dependency of a cell’s death rate due to treatment on the overall level of drug pressure (C) and the degree of resistance of the cell to drug treatment (x). This is an “inverted” IC50 surface, defined as D(C, x) = max(0; β(C − x)α. For higher levels of resistance (higher values of trait x), death rate remains low even when drug concentrations increase. For intermediate levels of drug concentration, cancer cells with low resistance are cleared at a much faster rate, while those with high levels of resistance remain protected. High resistance comes with a cost, as shown in B, where λ = λmax − xs(λmax − λmin).
