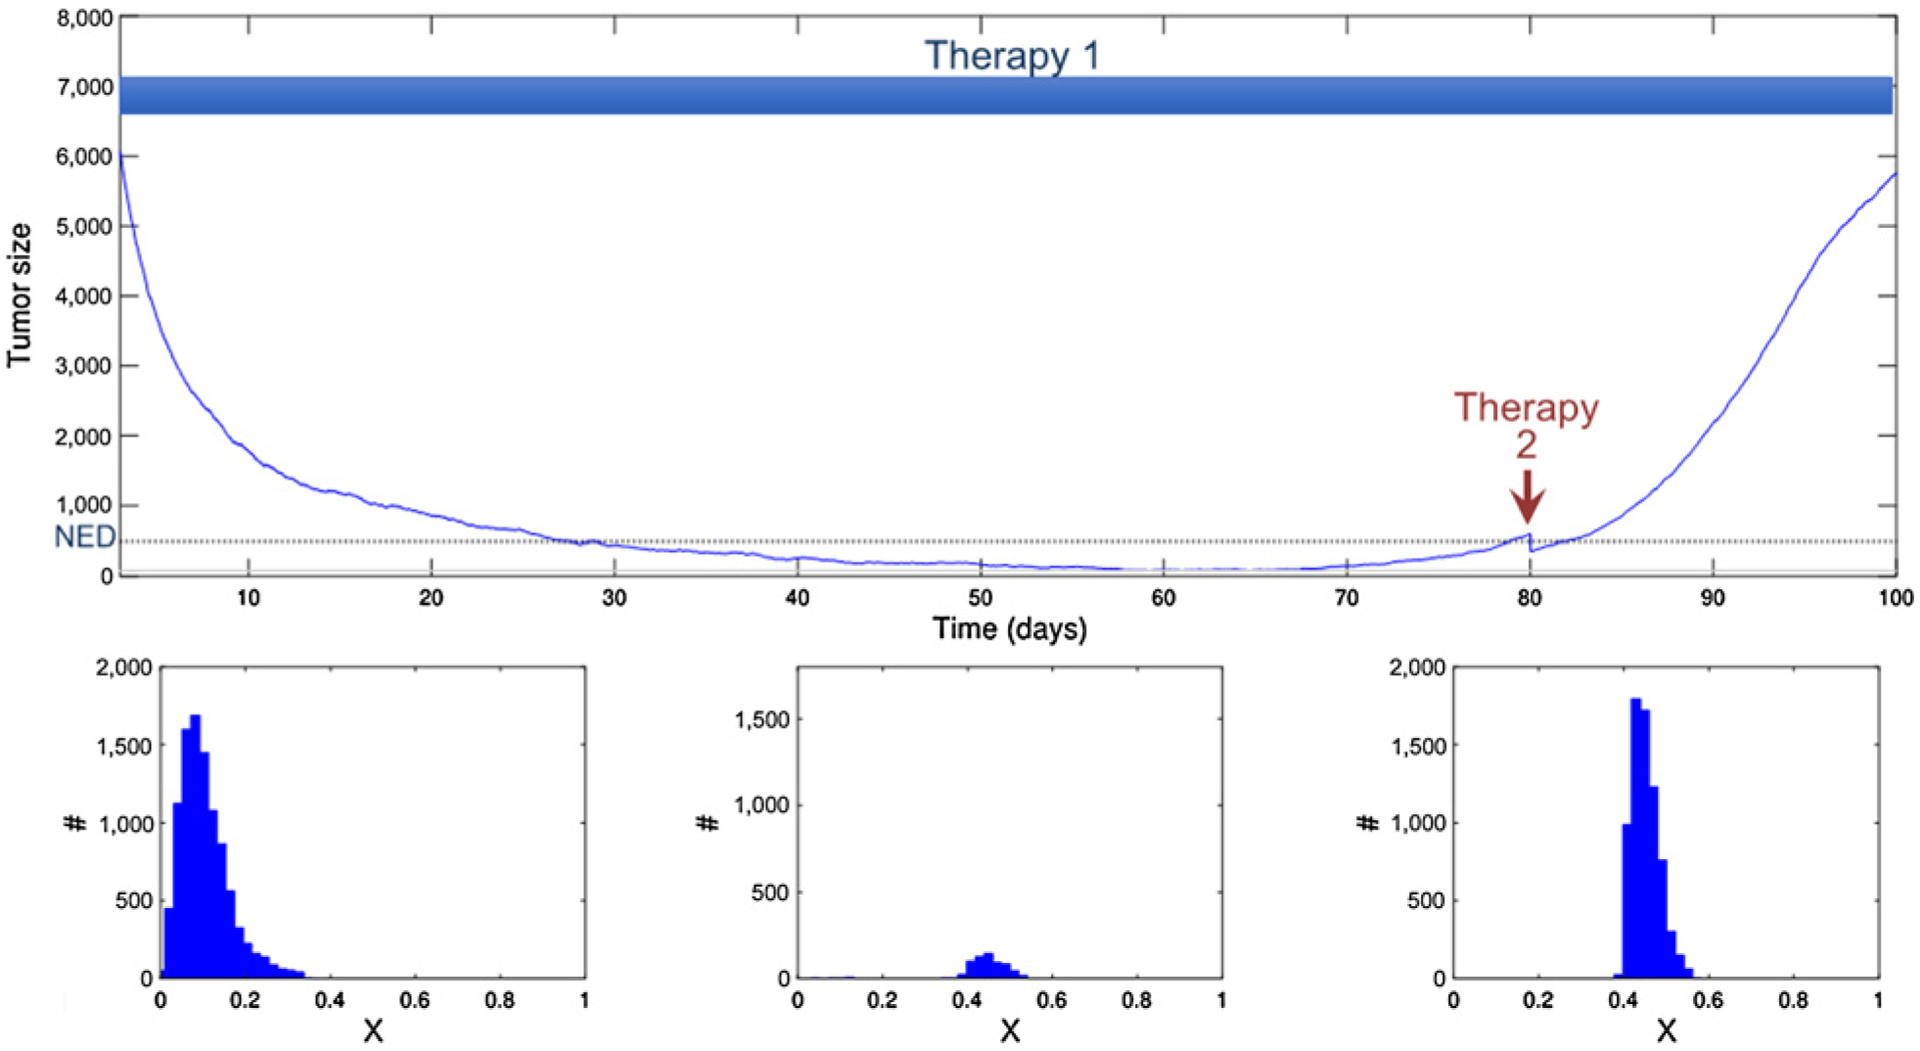
Figure 4.

Initial therapy achieves a complete response and is continued at MTD until a measurable recurrence is observed. However, waiting for measurable tumor has allowed the tumor population to increase in size and diversity. The second drug is less effective than the first-line treatment and reduces the cancer population by 40%. This transiently reduces the population below NED, but resistance rapidly emerges leading to progression. The histogram shows the phenotypic heterogeneity within the population before treatment (left), just before the second strike (middle), and after recurrence (right).
