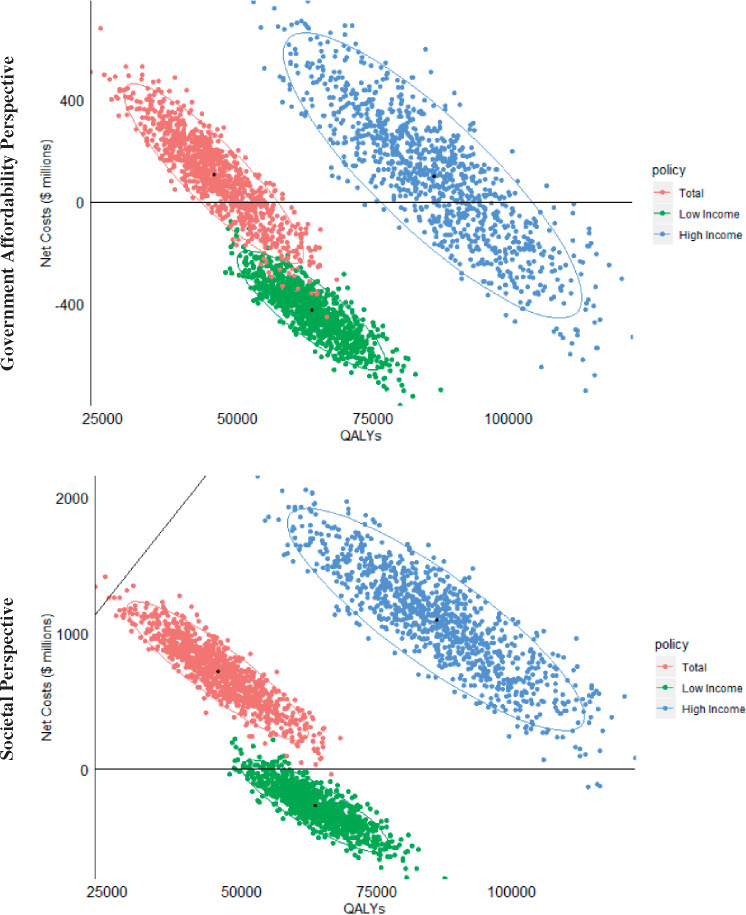
Figure 5.
Estimated incremental cost-effectiveness ratio (ICER) of a penny-per-ounce national sugar-sweetened beverage tax among US adults over a lifetime by income status. ICER was calculated as the ratio of net costs ($ million in 2015 US dollars) divided by quality-adjusted life-years (QALYs) gained. Blue dots correspond to the ICERs among the total US adult population, green dots among low-income adults, and red dots among higher-income adults. Low-income was defined as the federal poverty-to-income ratio (FPIR) ≤ 1.85 and higher-income as FPIR > 1.85.

