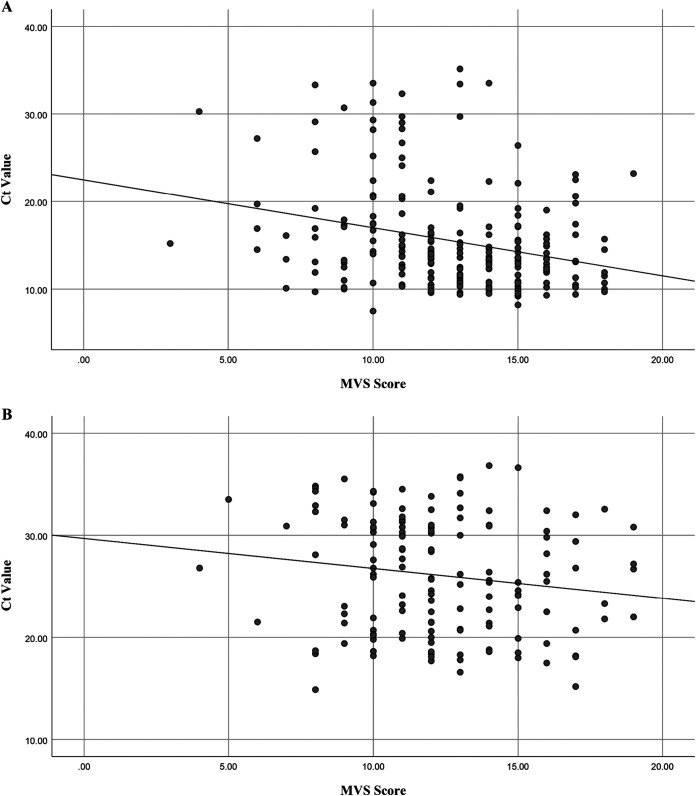
FIG 5.
Scatterplots showing the relationship of adenovirus stool cycle threshold (Ct) values and modified Vesikari scale scores with a fitted linear regression line. (A) Adenovirus serotype F40/41 (n = 218) (Pearson correlation coefficient, −0.28; P < 0.0001). (B) Adenovirus non-F40/41 serotypes (n = 144) (Pearson correlation coefficient, −0.16; P = 0.06).

