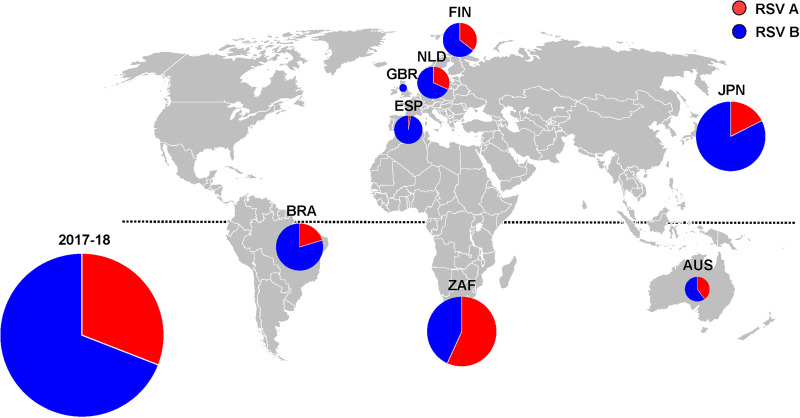
FIG 1.
Geographic distribution of RSV A (n = 128) and RSV B (n = 283) subtypes, 2017–2018 (n = 8 countries). Overall size of the pies is proportional to the number of RSV isolates and the segments of the pies are proportional to the frequency of subtype A (red) and subtype B (blue) (Table 1). Northern hemisphere: GBR, United Kingdom (n = 2); ESP, Spain (n = 36); NLD, The Netherlands (n = 43); FIN, Finland (n = 45); JPN, Japan (n = 91). Southern hemisphere: BRA, Brazil (n = 64); ZAF, South Africa (n = 95); AUS, Australia (n = 34). (The figure was created with Microsoft PowerPoint.)

