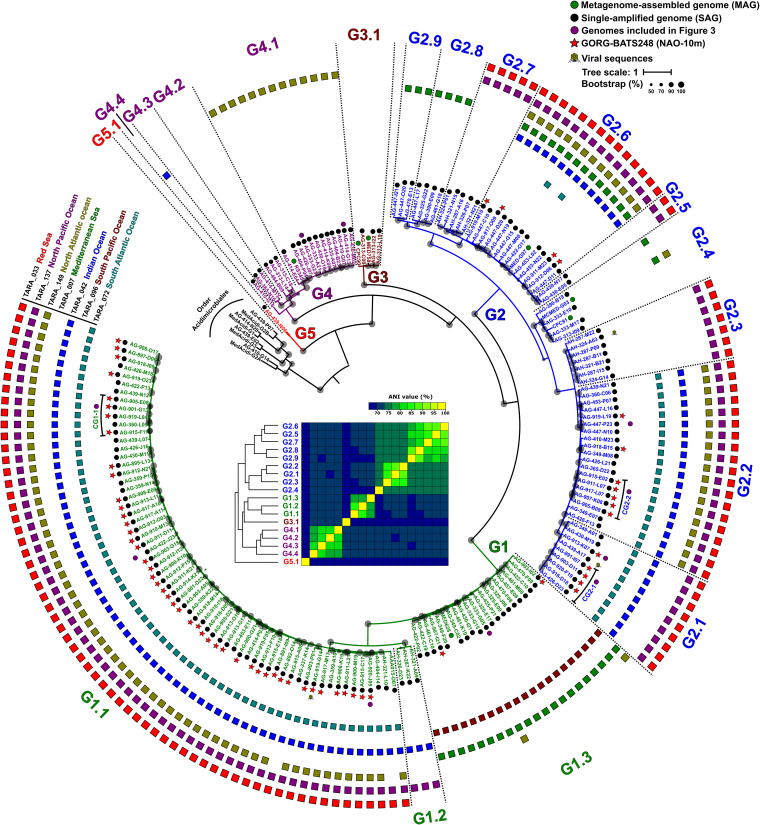
FIG 1.
Maximum likelihood phylogenomic tree of the “Ca. Actinomarinales” genomes. Colored dots next to the genome identifier indicate the origin of the genome that is MAG (green) or SAG (black). Red stars show genomes from a single sample collected at the BATS station. Purple dots indicate genomes used to produce the composite genomes and genomes used in Fig. 3. Branches of the tree and names were colored according to the genera as follows: G1 (green), G2 (blue), G3 (brown), G4 (purple), and G5 (red). Dotted lines divide the different genomospecies within each genus. Outer rings show the presence (RPKGs >5) in surface TARA-reference metagenomes covering different geographical sites. Bootstrap values are indicated as black circles on the nodes. The inset shows the average nucleotide identity (ANI) matrix of genomospecies colored by genera.

