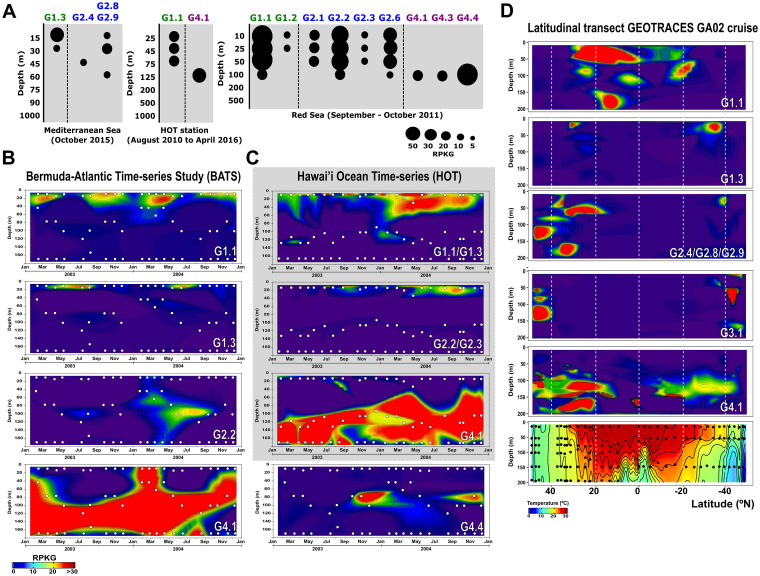
FIG 2.
Relative abundance of “Ca. Actinomarinales” genomospecies in: (A) vertical profiles from Western Mediterranean Sea, Red Sea, and North Pacific Ocean; (B) 2-year metagenomic time series collected at monthly intervals at BATS; and (C) HOT stations during the GEOTRACES cruises. (D) Latitudinal transect following the GEOTRACES GA02 cruise. The temperature profile is shown in the last box. White and black dots indicate locations of the metagenomic samples.

