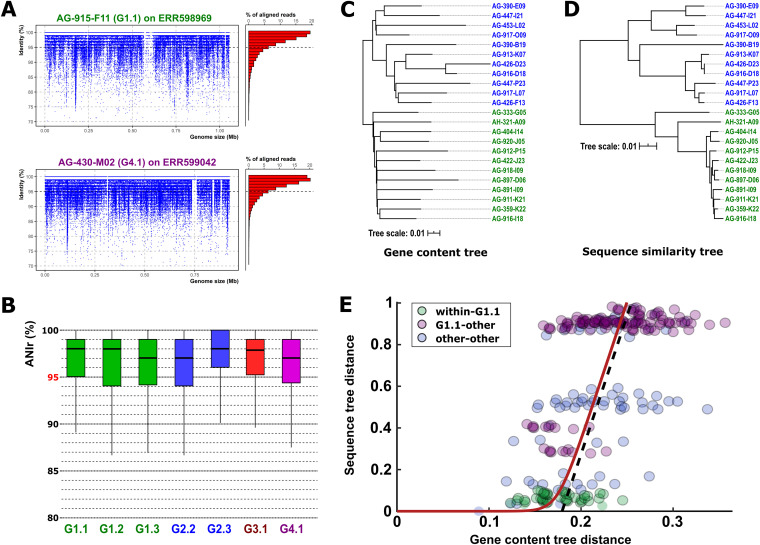
FIG 4.
(A) Linear recruitment plot of the reference genomes AG-915-F11 (G1.1) and AG-430-M02 (G4.1). Each blue dot represents a metagenomic read. The histogram on the right shows the relative percentage of aligned reads in intervals of 1% identity. The black dashed line indicates the species threshold (95%). (B) Boxplot indicating the average nucleotide identity based on metagenomic reads (ANIr). (C and D) Phylogenetic trees based on the concatenated alignment of genes shared by all members of the group (C) and proportional number of estimated gene gain and loss events (D). (E) Comparison of gene content divergence and core-gene sequence divergence in “Ca. Actinomarinales” genomes. Each circle represents a pair of genomes; colors indicate pairs of genomes within the G1.1 genomospecies (green), between the G1.1 and a different genomospecies (purple), and between members of genomospecies other than G1.1 (blue). The red line shows the best fit to the recombination-driven delay model of genome evolution. The dashed line provides a visual clue highlighting the transition from the recombination-bound regime to the linear divergence regime.

