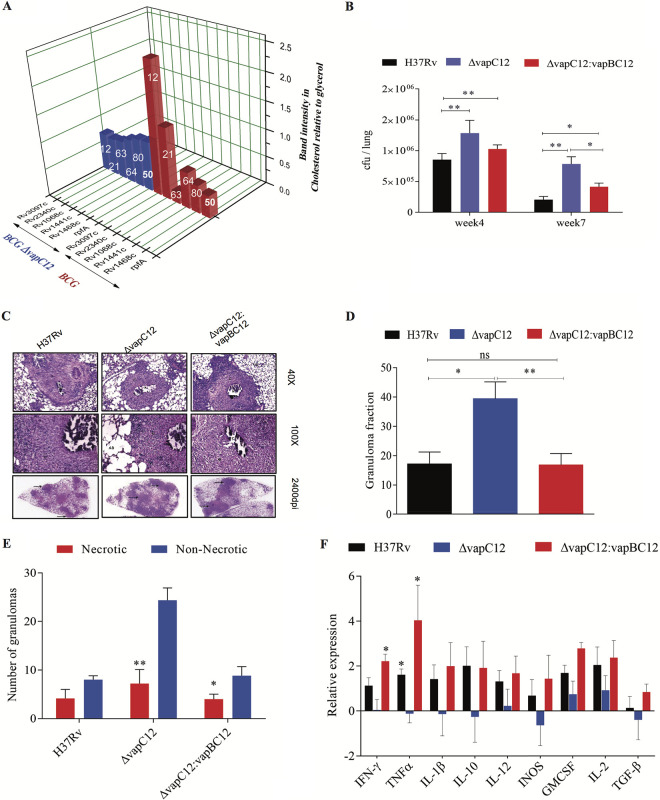
FIG 4.
vapC12-mediated downregulation of the proT-encoded proline-rich proteins is essential for the persistence of M. tuberculosis in a guinea pig model of infection. (A) Relative band intensity representing the expression of His-tagged PE-PGRS and RpfA proteins in BCG and vapC12 mutant strains grown in glycerol and cholesterol media. The numbers on each individual bar represent the percentages of ProT codon in that particular protein. The protein lysates were prepared from overexpressed strains with an OD of 0.8 to 1. The samples were run on SDS-PAGE and probed with an anti-His antibody. (B) Bacterial load in the lungs of guinea pigs infected with H37Rv, ΔvapC12, and ΔvapC12:vapBC12 M. tuberculosis strains. At the designated time points, the lungs were homogenized in 4 ml of saline, and 10-fold serial dilutions of homogenates were plated on 7H11+OADC plates. Each group constituted six guinea pigs per time point. The data plotted represent the means ± the SEM. Significant differences observed between groups are indicated. Data were analyzed using the Mann-Whitney U test (**, P < 0.01; *, P < 0.05). (C) Photomicrographs of H&E-stained (40× and 100×) and high-resolution scanning (2,400 dpi) of lung sections from guinea pigs infected with different strains of M. tuberculosis at 7 weeks postinfection. (D) Granuloma fraction of the lung tissue samples of guinea pigs infected with different strains of M. tuberculosis, based on the semiquantitative estimation of the fraction of the lung tissue covered with granuloma. Data were analyzed using the Mann-Whitney U test (*, P < 0.05; **, P < 0.01). (E) Total number of necrotic and nonnecrotic granulomas in the lung tissue samples of guinea pigs infected with different strains of M. tuberculosis. Data were analyzed using the Mann-Whitney U test (*, P < 0.05; **, P < 0.01; ***, P < 0.001). (F) Cytokine profiling of animals infected with H37Rv, ΔvapC12, and ΔvapC12:vapBC12 strains of M. tuberculosis. RNA was extracted from the spleens of infected animals at 7 weeks postinfection. The relative expression of cytokines in different groups of animals was quantified through qRT-PCR. Data were normalized with the findings of the uninfected group. The data plotted represent the means ± the SEM. Data were analyzed using the Mann-Whitney test (*, P < 0.05; **, P < 0.01).

