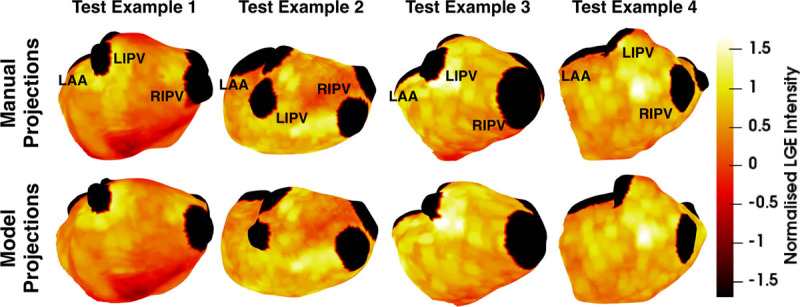
Figure 6.

Automatic and manual projections. Examples of atrial meshes from the test set with fibrosis projected on their surfaces. Late gadolinium enhancement (LGE) intensities were normalized using the mean blood pool intensity. The pulmonary veins are clipped and represented in black. More fibrotic regions are depicted in yellow. LAA indicates left atrial appendage; LIPV, left inferior pulmonary vein; and RIPV, right inferior pulmonary vein.
