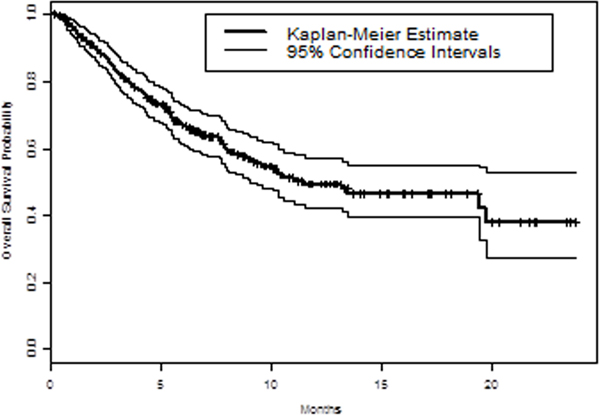
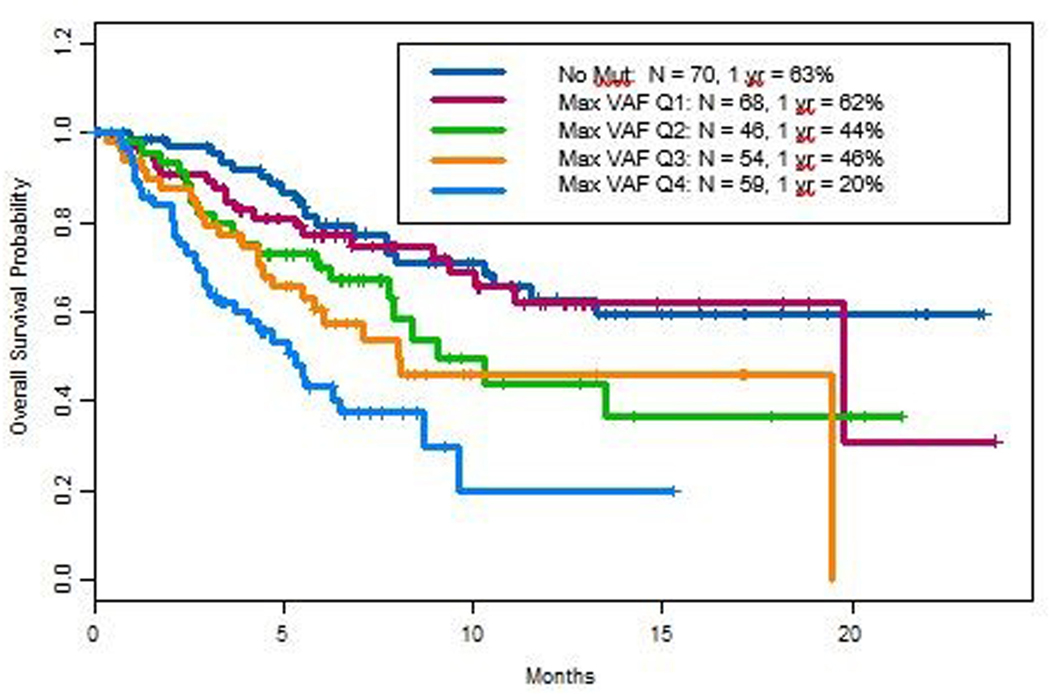
Figure 2. Variant allele frequency (VAF) and Overall Survival (OS).
A. Kaplan Meier estimate curve with 95% confidence intervals were plotted for OS of the study cohort. B. Kaplan Meier analysis of OS by maximum VAF. Maximum VAF was analyzed by quartiles, with Q4 and Q1 representing the highest and slowest quartile respectively.


