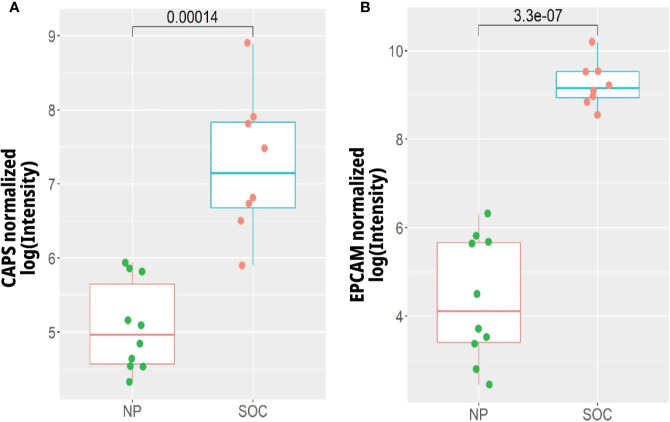
Figure 3.
Gene expression of (A) CAPS and (B) EPCAM in early stage I serous ovarian cancer tissues (SOC) (n = 8) compared to normal peritoneum (NP) (n = 10). Expression levels were extracted from the data of Yoshihara et al. (44) (GEO Accession GSE12470) via the R package CuratedOvarianData (http://www.ncbi.nlm.nih.gov/geo/).

