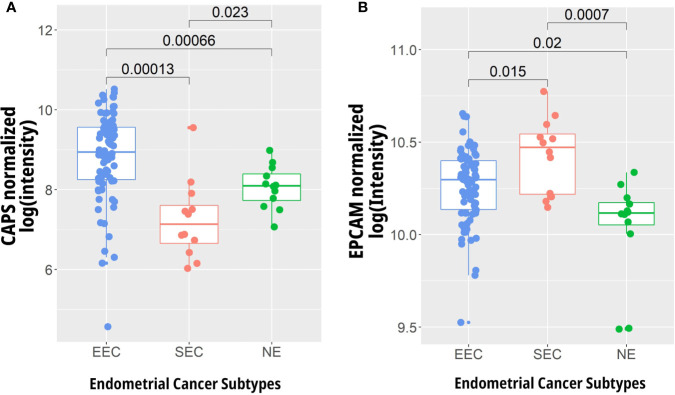
Figure 4.
Gene expression analysis of (A) CAPS and (B) EPCAM in early stage endometrioid (EEC) (n = 79) and serous (SEC) endometrial carcinoma (n = 12) compared to normal endometrium (NE) (n = 12). Expression levels were extracted from the data of Days et al. (46) (GEO Accession GDS4589, http://www.ncbi.nlm.nih.gov/geo/) using R.

