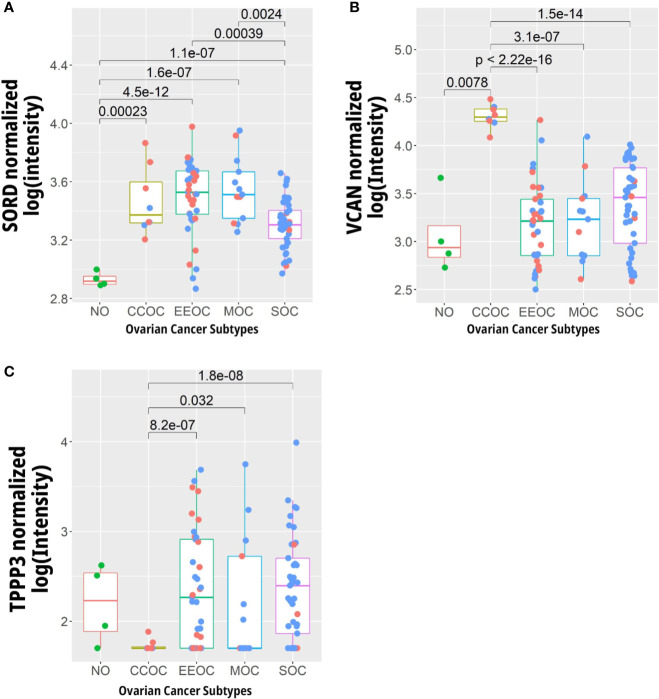
Figure 5.
Expression levels of genes whose protein abundance is specific to certain to gynaecological tissues. (A) SORD, (B) TPP3, and (C) VCAN in 4 normal ovarian (NO), 8 clear cell (CCOC), 37 endometrial (EEOC), 13 mucinous (MOC), and 41 serous (SOC) ovarian carcinomas. Blue dots represent data points from late stage patients while the red represent early stage. Data gathered from Hendrix et al. (45) (GEO Accession GSE6008, http://www.ncbi.nlm.nih.gov/geo/).

