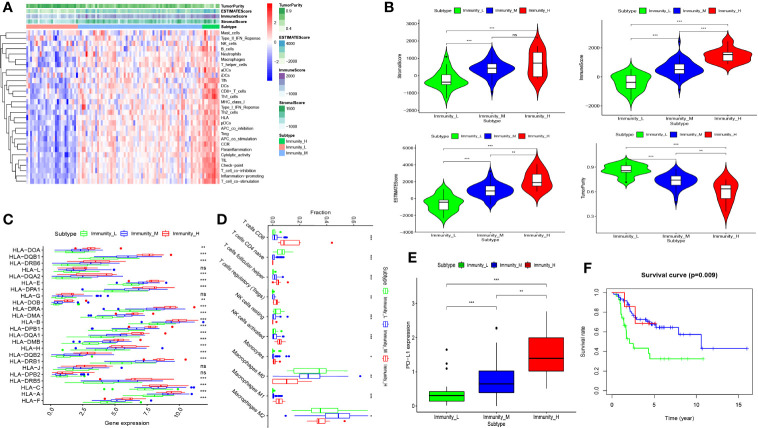
Figure 1.
Construction and validation of osteosarcoma clustering. (A) The enrichment levels of 29 immune-related cells and types in the high immune cell infiltration group (Immunity_H), middle immune cell infiltration group (Immunity_M), and the low immune cell infiltration group (Immunity_L). The Tumor Purity, ESTIMATE Score, Immune Score and Stromal Score of every patient gene were showed combine with the clustering information. (B) The violin plot showed the difference in ESTIMATE Score, Immune Score, Stromal Score, and Tumor Purity between three clusters. (C, D) The expression of most HLAs and PD-L1 was a significant difference in high- (red), middle- (blue), and low- (green) immune cell infiltration cluster. (E) the boxplot showed the proportion of immune cells among the high- (red), middle- (blue), and low- immune cell infiltration cluster(green) using CIBERSORT algorithm. (F) Patients in low immune cell infiltration cluster (green) showed worse overall survival than those in (middle- (blue), and low- (green) immune cell infiltration) cluster. nap > 0.05, *p < 0.05, **p < 0.01, ***p < 0.001. ns, no statistically significant.

