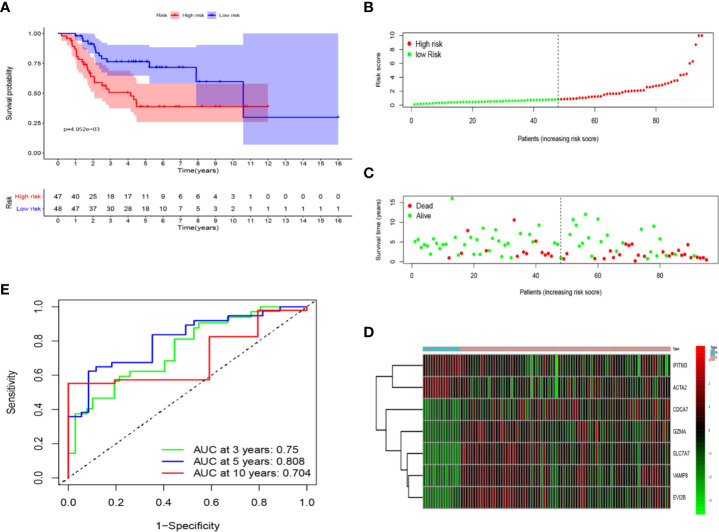
Figure 5.
The prognostic value of seven immune-related genes. (A) Patients in the low-risk group (blue) showed better overall survival than those in the high-risk group (red). (B) The risk curve of every sample arranged by risk score. (C) The scatter plot of osteosarcoma samples survival overview. The red and green dots stand for death and survival, respectively. (D) Heatmap showed the expression level of seven genes in the normal group (blue) and osteosarcoma group (red). (E) The ROC curve for 3-, 5-, and 10-year overall survival of osteosarcoma patients.

