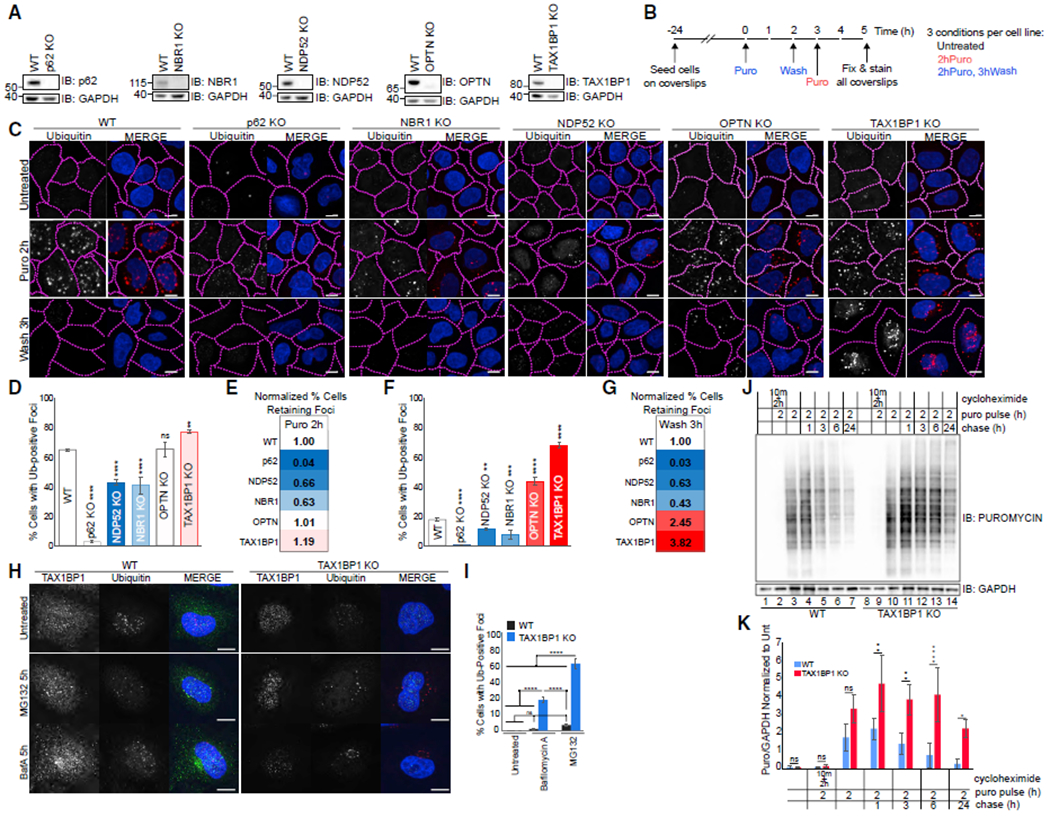
Figure 1. TAX1BP1 Depletion Impairs Clearance of Protein Aggregates.

(A) Validation of knockout cell lines.
(B) Experimental outline for assessing aggregate formation and clearance.
(C) WT or individual knockouts for p62, NBR1, NDP52, OPTN, and TAX1BP1 cell lines exposed to 5 μg/mL puromycin for 2 h were either fixed for imaging or washed and followed for a further 3 h in full media as in (B); scale bar represents 10 μm.
(D and F) Quantification of (C): percent of cells containing Ub-positive foci was assessed in ~200 cells per condition at 2 h puromycin (D) or 2 h puromycin followed by 3 h washout (F). Quantification displayed as mean ± SD from three independent experiments using one-way ANOVA test (**p < 0.01, ***p < 0.001, ****p < 0.0001) comparing all to WT and Tukey’s post hoc test.
(E and G) WT-normalized comparisons of foci formation and clearance in autophagy receptor knockout cell lines.
(H) WT or TAX1BP1 KO cells were exposed to 100 nM Bafilomycin A or 1 μM MG132 for 5 h then fixed for imaging.
(I) Quantification of (H): percent of cells containing Ub-positive foci was assessed in ~200 cells per condition. Quantification displayed as mean ± SD from three independent experiments using one-way ANOVA test, (****p < 0.0001) comparing all to WT and Tukey’s post hoc test.
(J) WT or TAX1BP1 KO cells pulsed with 5 μg/mL puromycin and 15 μM cycloheximide as indicated, then chased/harvested at the indicated time points and immunoblotted for puromycin or GAPDH (loading control).
(K) Quantification of (J) determined by densitometry, normalized first to GAPDH and subsequently to untreated condition for each cell line. Quantification displayed as mean ± SD from three independent experiments using two-way ANOVA test (**p < 0.01, ***p < 0.001, ****p < 0.0001) and Tukey’s post hoc test. All blots and microscopy images are representative of at least three independent experiments.
