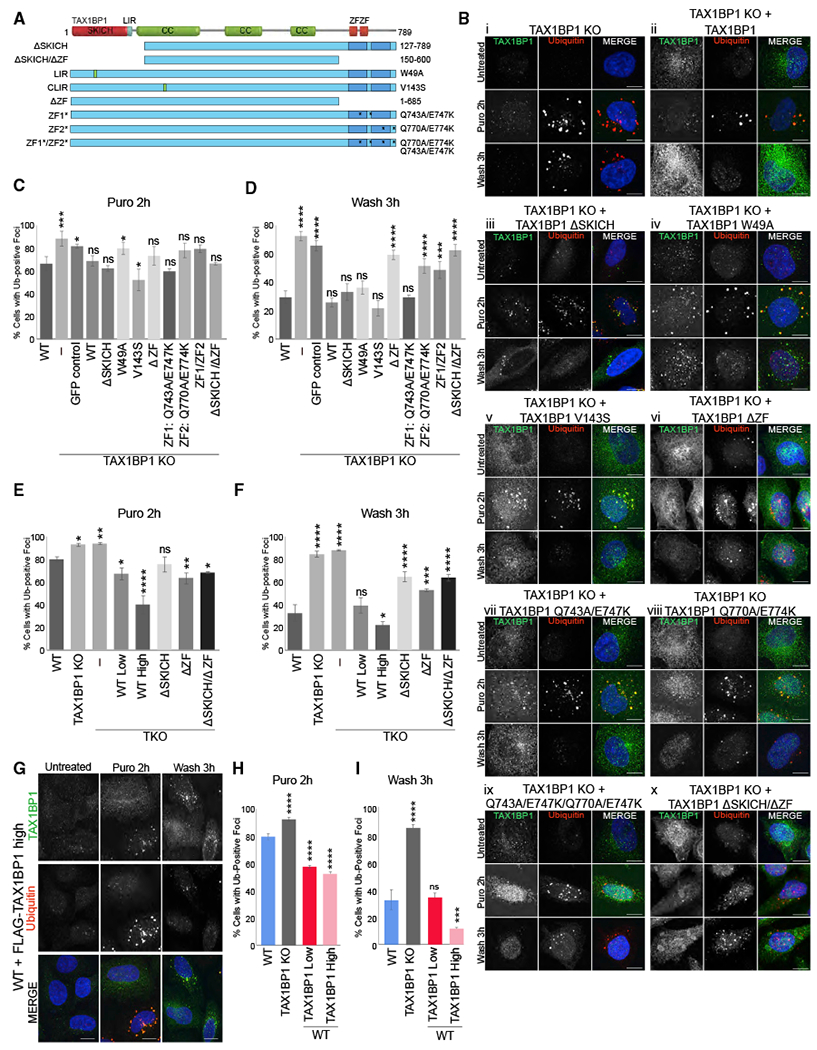
Figure 4. Requirements for TAX1BP1 Domains in Aggrephagy.

(A) TAX1BP1 truncation or point mutations used in this study.
(B) i–x, TAX1BP1 KO and TAX1BP1 KO with stable expression of TAX1BP1 mutants exposed to 5 μg/mL for 2 h were either fixed for imaging or washed and followed for a further 3 h in full media; scale bar represents 10 μm. Larger fields of view in Figure S7A.
(C and D) Quantification of Ub-foci formation (C) or clearance (D) observed in (B).
(E and F) Quantification of Ub-foci formation (E) or clearance (F) observed in TKO (OPTN/NDP52/TAX1BP1) ceils treated as in (B). See Figure S7B for images.
(G) WT cells stably expressing high levels of FLAG-TAX1BP1 exposed to 5 μg/mL puromycin for 2 h were either fixed for imaging or washed and followed for 3 h in full media; scale bar represents 10 μm.
(H and I) Quantification of Ub-foci formation (H) or clearance (I) observed in (G) and in Figure S7C. All images are representative of at least three independent experiments in which percent of cells containing Ub-positive foci was assessed in ~200 cells per condition. All quantification displayed as mean ± SD from three independent experiments using one-way ANOVA test comparing to WT (*p < 0.05, **p < 0.01, ***p < 0.001, ****p < 0.0001) and Tukey’s post hoc test.
