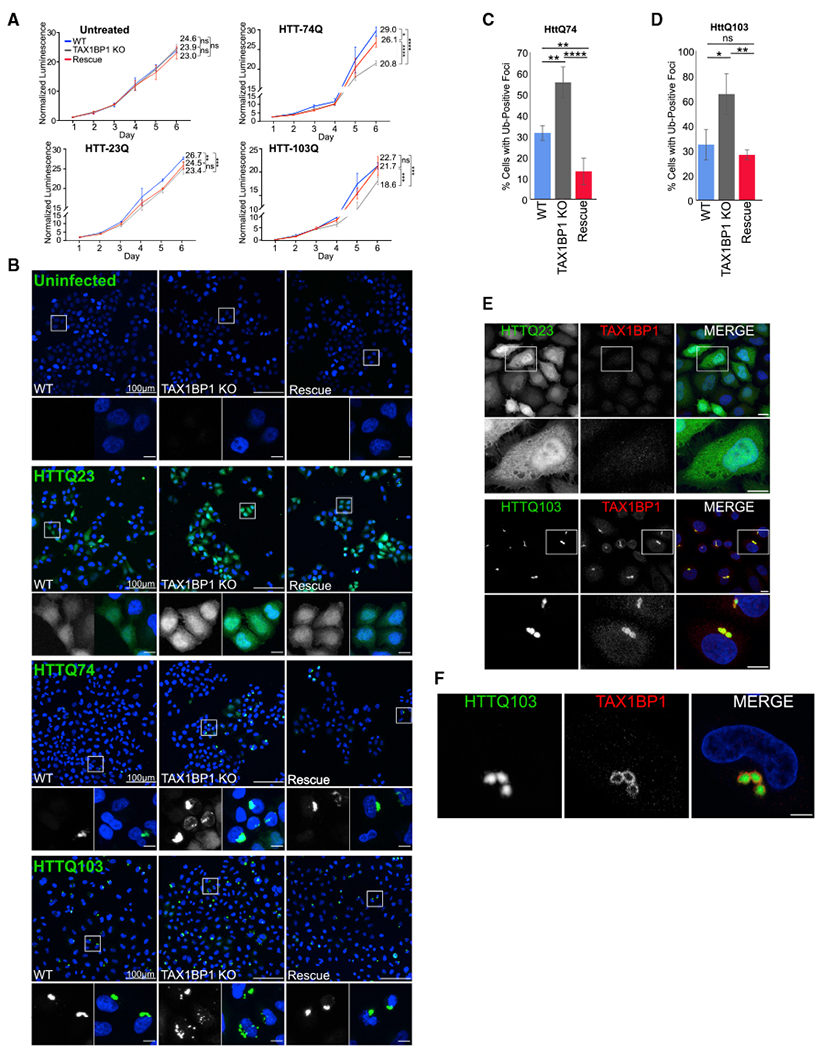
Figure 5. TAX1BP1 Mediates Aggrephagy of Cytotoxic Aggregation-Prone Proteins.

(A) WT, TAX1BP1 KO, or TAX1BP1 KO cells with stably expressed TAX1BP1 rescue were exposed to proteotoxic stressors as indicated on day 1 and followed for 6 days during which viability was measured by quantification of ATP production. Relative viability represents normalized luminescence displayed as mean ± SD from three independent experiments; significance was assessed using two-way ANOVA test (****p < 0.0001, ***p < 0.001, **p<0.01, *p< 0.05) with Tukey’s post hoc test. p values and normalized viability measurements shown on graphs are for day 6 comparisons.
(B) WT, TAX1BP1 KO, or rescue cells uninfected or infected with viruses expressing HttQ23-EGFP, HttQ74-EGFP, or HttQ103-EGFP were assessed for aggregate count 4 days post-infection.
(C) Quantification of HttQ74-EGFP aggregates observed in (B). Quantification is displayed as mean ± SD from three independent experiments using one-way ANOVA test (*p < 0.05, **p < 0.01, ****p < 0.0001) and Tukey’s post hoc test.
(D) Quantification of HttQ103-EGFP aggregates observed in (B), percent of cells containing GFP-positive foci was assessed in ~200 cells per condition in three independent experiments. Quantified as in (C).
(E) Immunofluorescence labeling of endogenous TAX1BP1 in cells infected with HttQ23-EGFP or HttQ103-EGFP. Maximum intensity projections shown.
(F) A single 1-μm slice of immunofluorescence labeling of endogenous TAX1BP1 in cells infected with HttQ103-EGFP as in (E). Scale bars represent 10 μm. All images are representative of at least three independent experiments.
