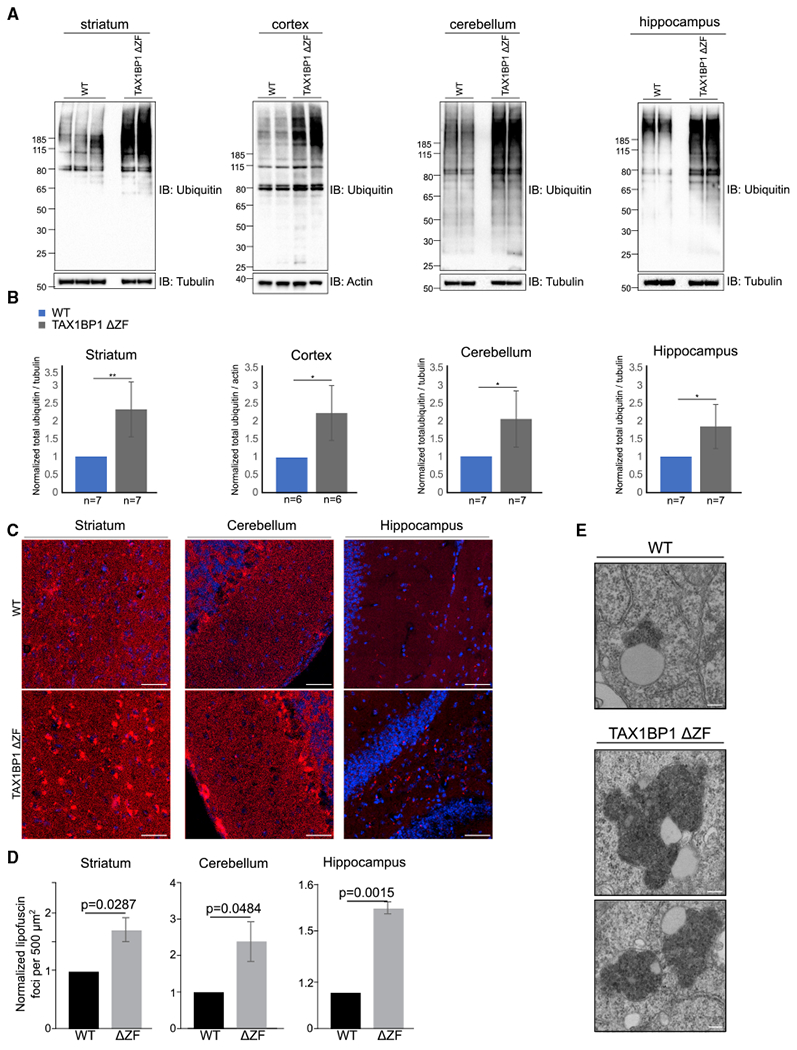
Figure 7. TAX1BP1 KO Mice Accumulate Ubiquitin and Lipofuscin in Multiple Brain Regions.

(A) Representative immunoblots of total Ub and loading controls in lysate from striatum, cerebellum, cortex, or hippocampus of 35–38-week-old WT and TAX1BP1 ΔZF mice.
(B) Quantification of total Ub signal normalized to loading control displayed as mean ± SEM.; significance was assessed using two-tailed Welch’s t test (**p < 0.01, *p < 0.05).
(C) Representative images of lipofuscin deposits (red puncta) in WT and TAX1BP1 ΔZF mouse striatum, cerebellum, or hippocampus sections imaged used 555 nm autofluorescence. Nuclei stained with DAPI. Scale bars represent 10 μm.
(D) Quantification of normalized counts of lipofuscin punctae per 500 μm2 displayed as mean ± SEM; significance was assessed using two-tailed Welch’s t test (*p < 0.05).
(E) Representative image of electron-dense storage material in postmortem cortical tissue from TAX1BP1 ΔZF mouse brain. Scale bars represent 200 nm.
