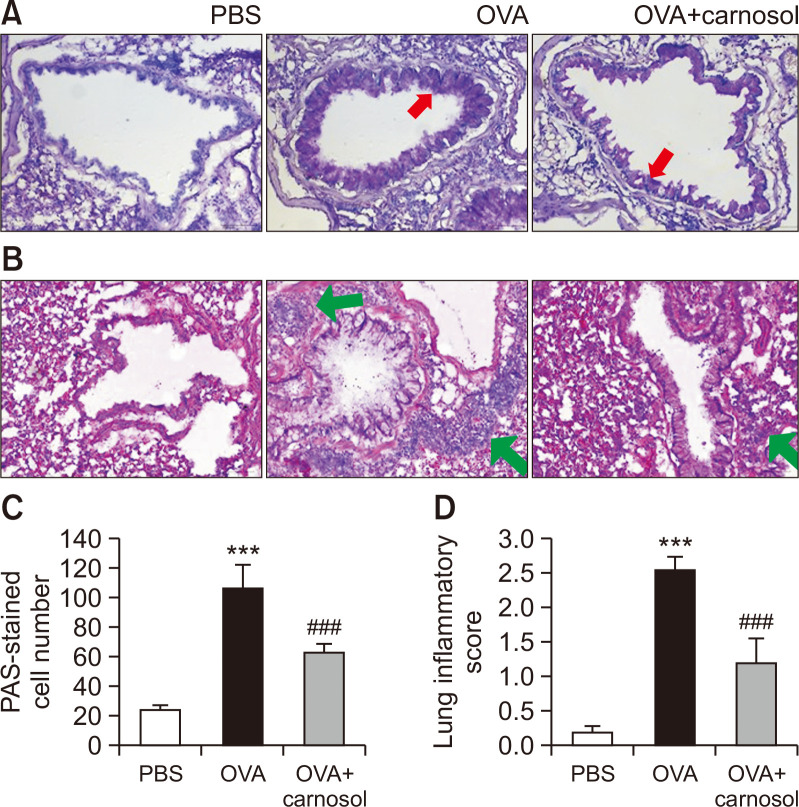
Fig. 4.
Protective effect of carnosol against airway inflammation and mucin production. (A) Panels show H&E-stained sections of lung tissues from the PBS group, OVA group, and carnosol plus OVA group. Sections from mice in the OVA-induced and carnosol-treated OVA-induced groups showed an accumulation of eosinophils (small navy blue dots, green arrows). (B) Panels show PAS-stained sections of lung tissues. Mucin is stained in purple color (red arrows). (C) Lung inflammation was semi-quantitatively evaluated. Histological findings were scored as described in the materials and methods section. (D) Mucous production was evaluated by counting the number of PAS-positive cells per mm of bronchiole (n=5 per group). Bar=50 μm. Graphs represent the mean ± SE values (n=5). ***p<0.001 vs. the PBS-treated group, ###p<0.001 vs. the OVA-treated group.

