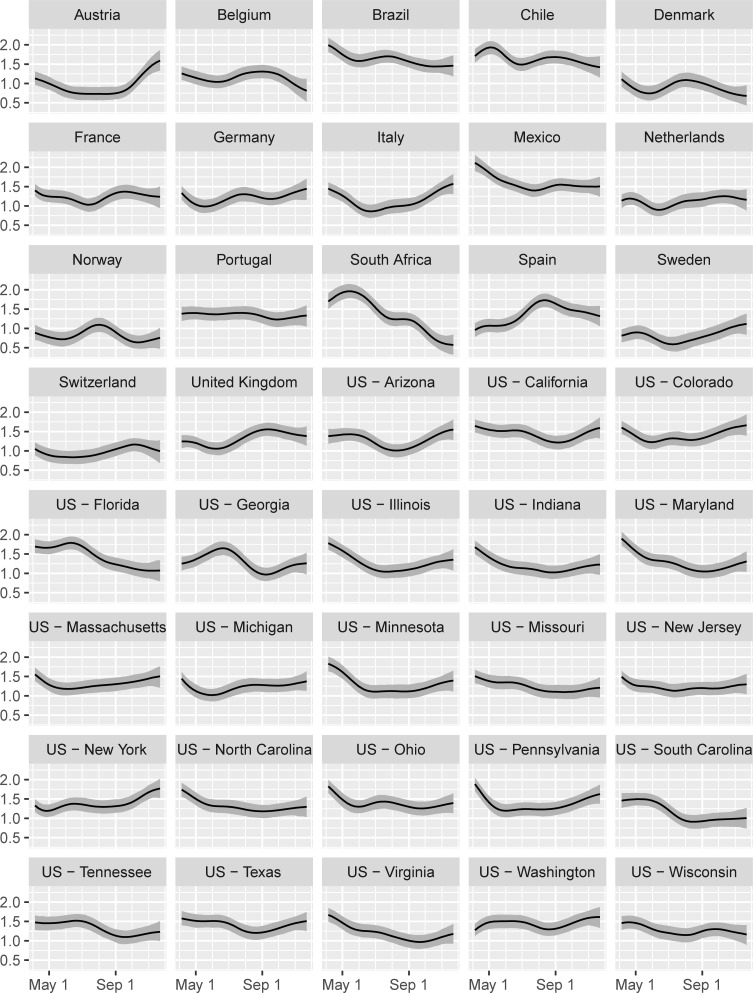
Fig 5. Growth rate g(base) after jurisdictions have started to implement one of the base policies (level 1 of C1-C4).
A lower number indicates a higher effectiveness to contain the virus. The total growth rate git of the virus is the number in this chart minus the sum of the effects of implemented policies in Fig 3. Lines = median estimates; Grey bands = 95% intervals

