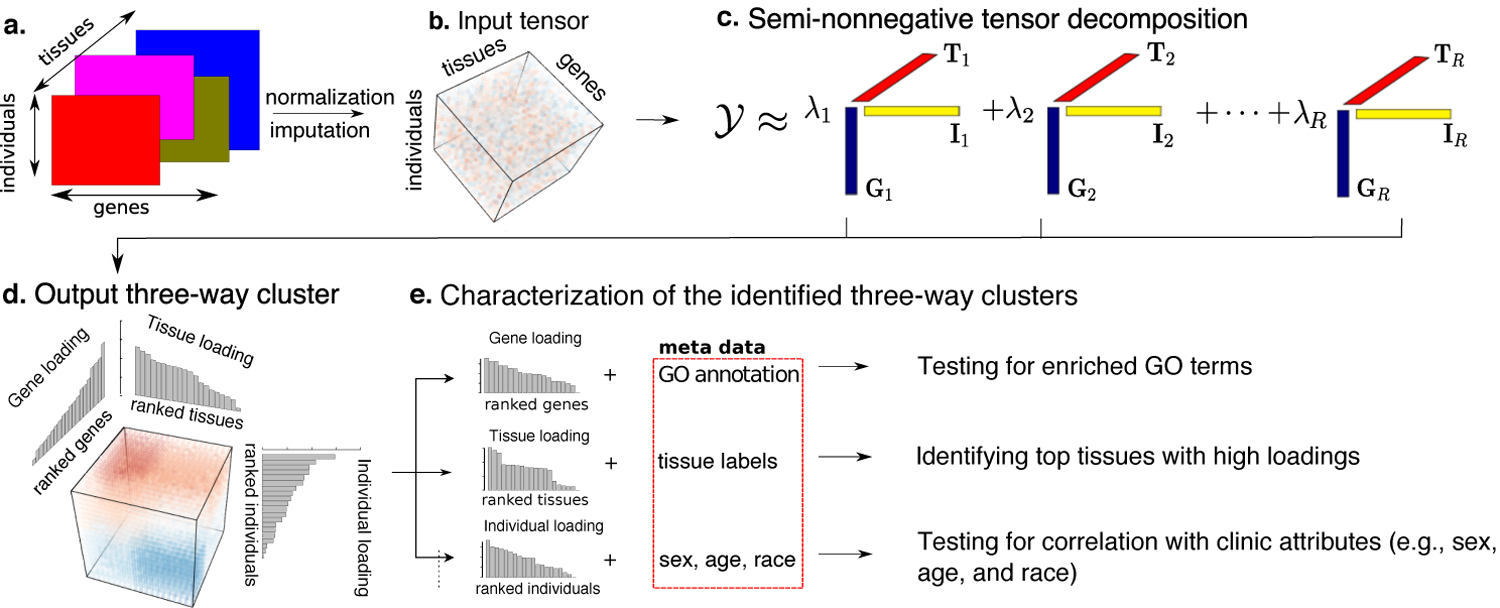
Fig 2.

Schematic diagram of MultiCluster method. (a) Multi-tissue multi-individual gene expression data. (b) Input expression tensor after normalization and imputation. (c) Our method decomposes the expression tensor into a set of rank-1 tensors, Gr ⊗Ir ⊗Tr, where Gr, Ir, and Tr are, respectively, gene, individual, and tissue singular vectors. (d) Each three-way cluster is represented by the three sorted singular vectors. (e) We utilize metadata, such as gene ontology (GO) annotation, tissue labels, and individual-level covariates, to identify the sources of variation in each loading vector.
