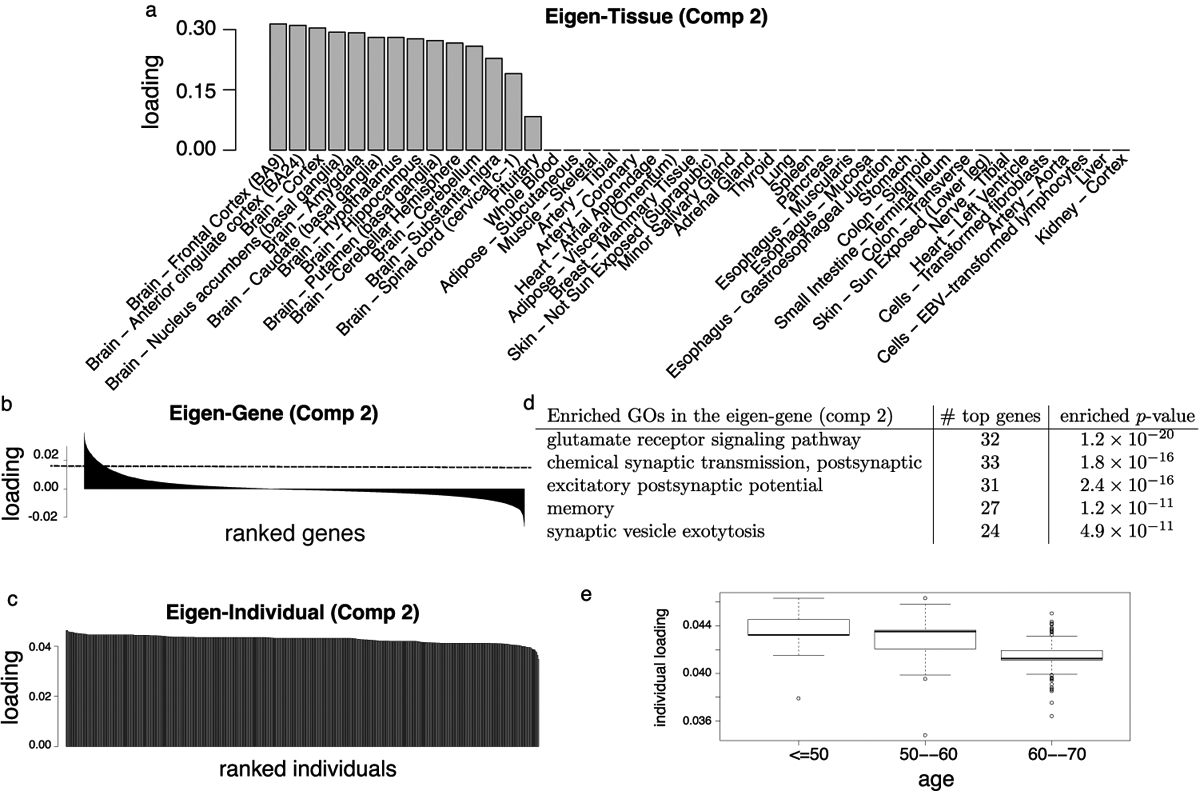
Fig 6.

Expression module II: brain tissues. (a) Barplot of the sorted tissue loading vector. (b) Barplot of the sorted gene loading vector, where the dotted line represents the threshold for the top genes. (c) Barplot of the sorted individual loading vector. (d) Enriched GO annotations among the top 899 genes identified from the gene loading vector. Enrichment p-values are obtained from hypergeometric tests with BH correction. (e) Boxplot of individual loadings against age.
