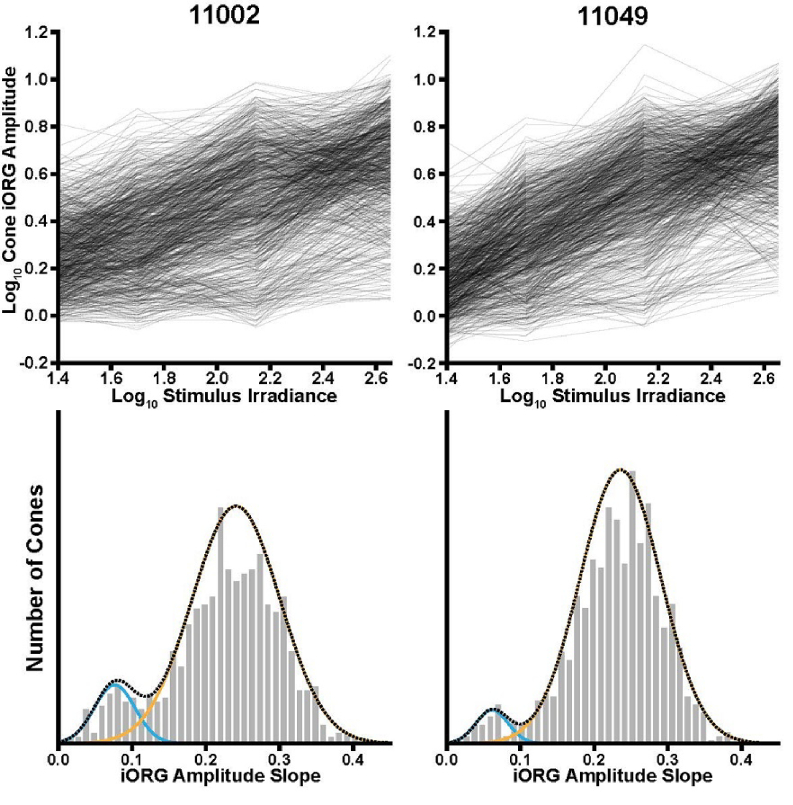
Fig. 3.
The iORG amplitude of individual cones increases as a function of irradiance. Top row: The individual cone iORG amplitudes for each subject (black lines) were fit with a fixed 0-intercept linear regression line to determine their slope. Bottom row: Histograms of the log10 iORG amplitude versus irradiance slope for each cone and each subject. With this visualization, two distinct populations emerged. To distinguish between the two populations, each distribution was fit using a two-component Gaussian mixed model. Cones were classified by determining which Gaussian had the higher probability for any given slope.

