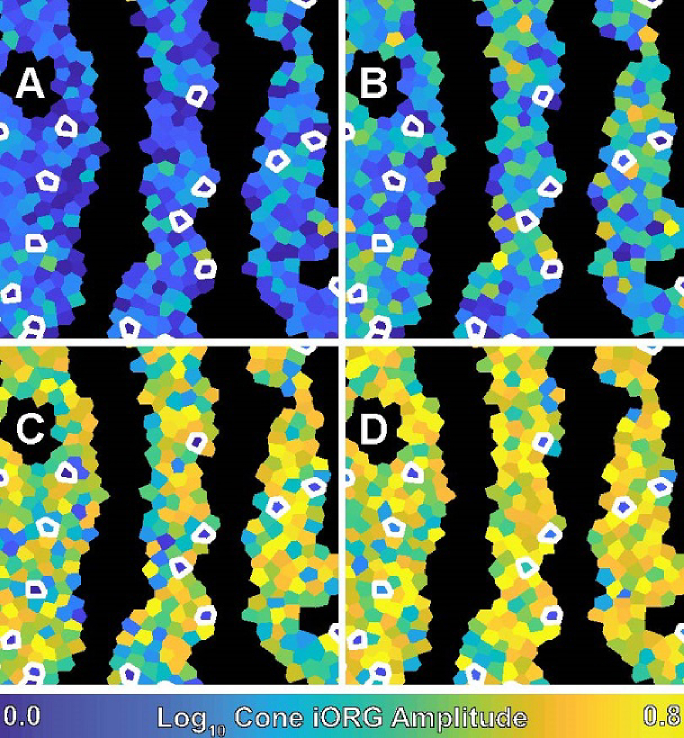
Fig. 4.
A color-coded Voronoi diagram of the individual cone iORG amplitude in subject 11049. Each Voronoi region corresponds to a single cone and is color-coded based on its amplitude. Dark regions are where cones were excluded because of the detection of a blood vessel. White outlines indicate putative S cones as classified by slope. The panels correspond to A) 25 nW/deg2, B) 50nW/deg2, C) 140nW/deg2, and D) 450nW/deg2.

