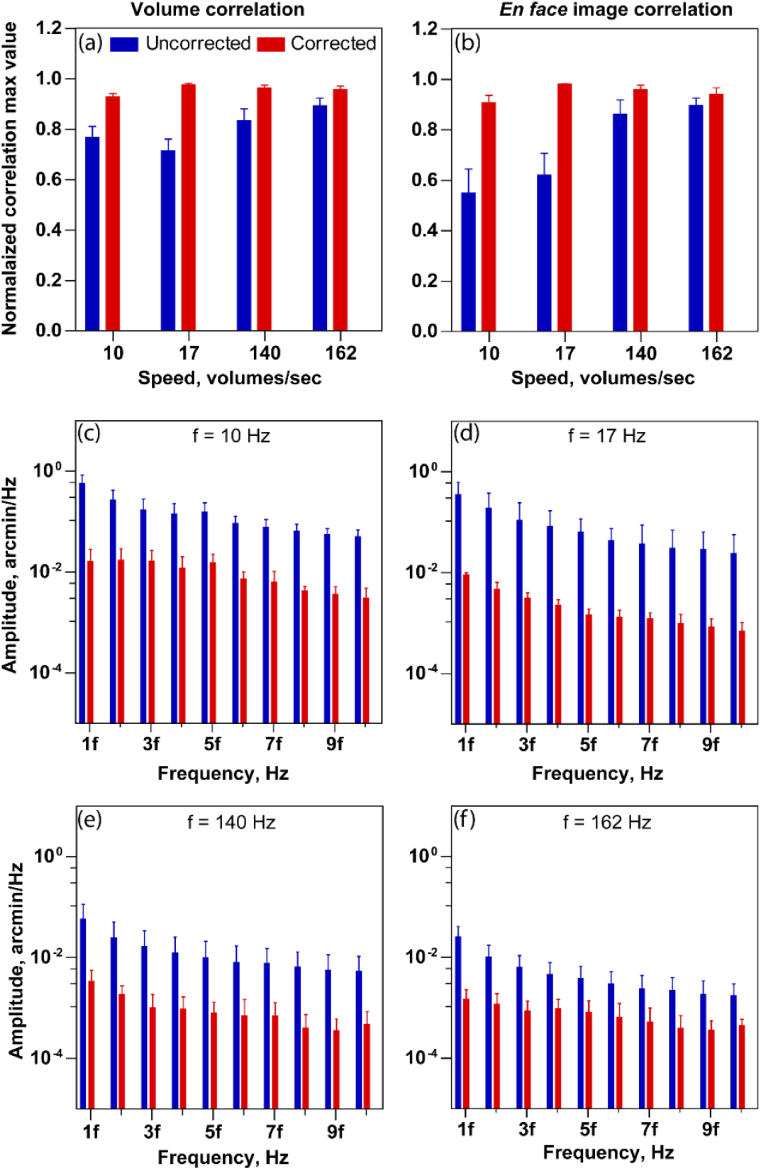
Fig. 9.
Performance evaluation of reference volume correction for subject 1 at volume rate 10 Hz, 17 Hz, 140 Hz and 162 Hz. 3D normalized cross-correlation peak (a) and 2D normalized cross-correlation peak (b) between the randomly selected reference volumes for 3D correlation based registration at different volume rates. Note in (b), only the enface photoreceptor images are used for cross correlation. (c)–(f) shows the amplitude spectrum peak amplitude at the multiple of volume rate at different speeds, for the line dimension. Five randomly selected reference volumes were used in all cases at speeds of 10, 17, 140 and 162 volumes/sec. The error bars indicate the standard deviation of maximum cross correlation value obtained by the combination of all five reference volumes.

