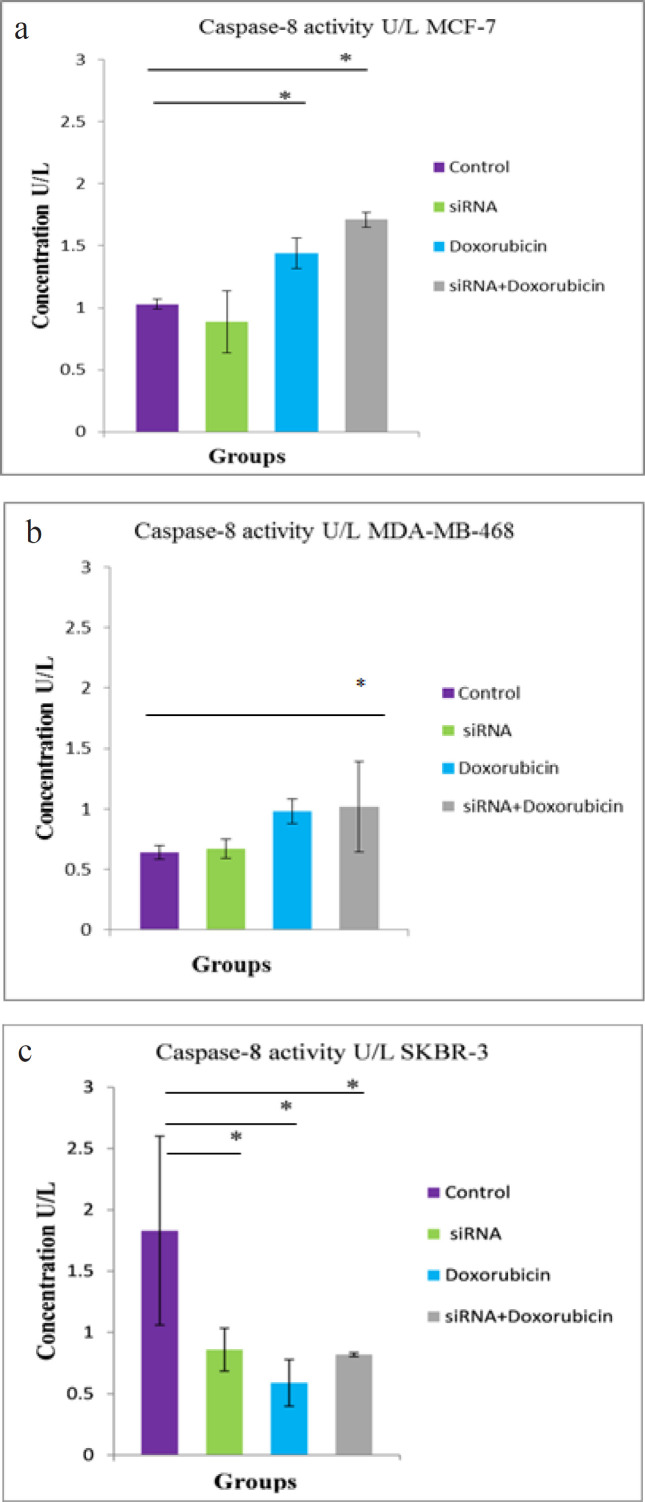
Figure 4.
Caspase-8 Activity in a) MCF-7 b) MDA-MB-468 and c) SKBR-3 cell lines 72 hours after exposure to hTERT siRNA and doxorubicin. The difference between means was carried out using one-way analysis of variance (ANOVA). Data are shown as mean ± SD (error bar) of 3 experiments, * data are significant at P < 0.05

