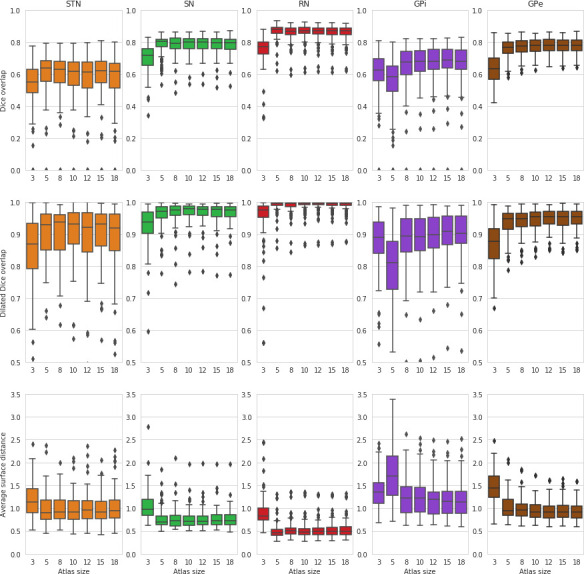
Figure 6. MASSP parcellation scores as a function of increasing number of subjects included in the atlas.

Scores for the left and right side are computed separately and then combined into box-and-whisker plots.

Scores for the left and right side are computed separately and then combined into box-and-whisker plots.