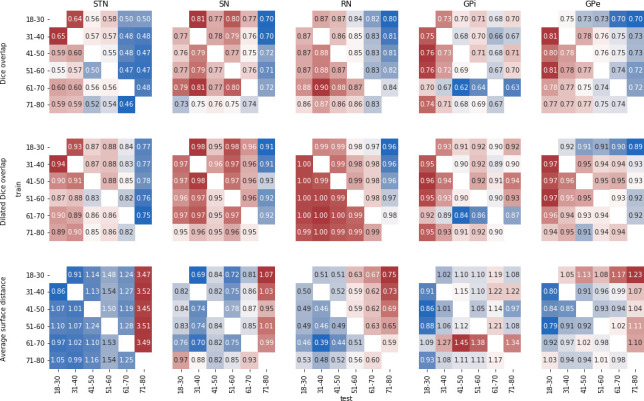
Figure 7. MASSP parcellation scores over the lifespan.

Each matrix show the average Dice overlap (top), dilated Dice overlap (middle), and average surface distance (bottom) for using one age group as prior (’train’) to parcellate another age group (’test’).
