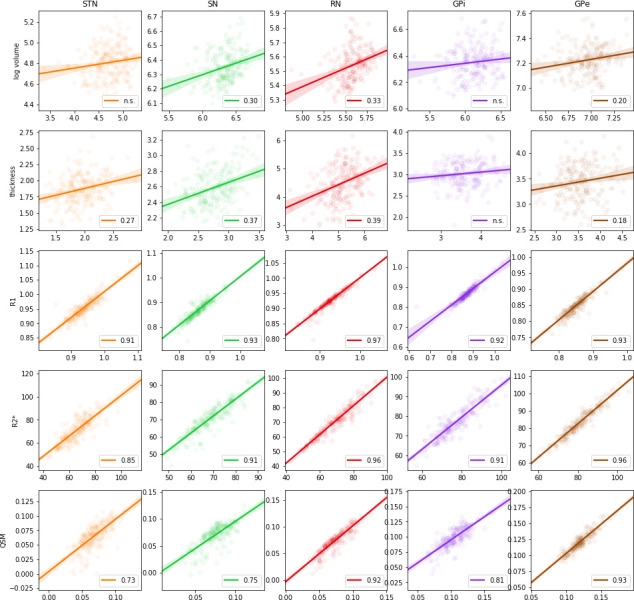
Figure 8. Regression of volume (log scale), structure thickness, R1, R2*, and QSM MRI parameters estimated using manual delineations versus MASSP automated parcellations.

Circles show individual data points, linear regression is indicated by a straight line, and 95% confidence interval is given as the shaded area. Pearson correlation coefficients are indicated when significant (p-value<0.01).
