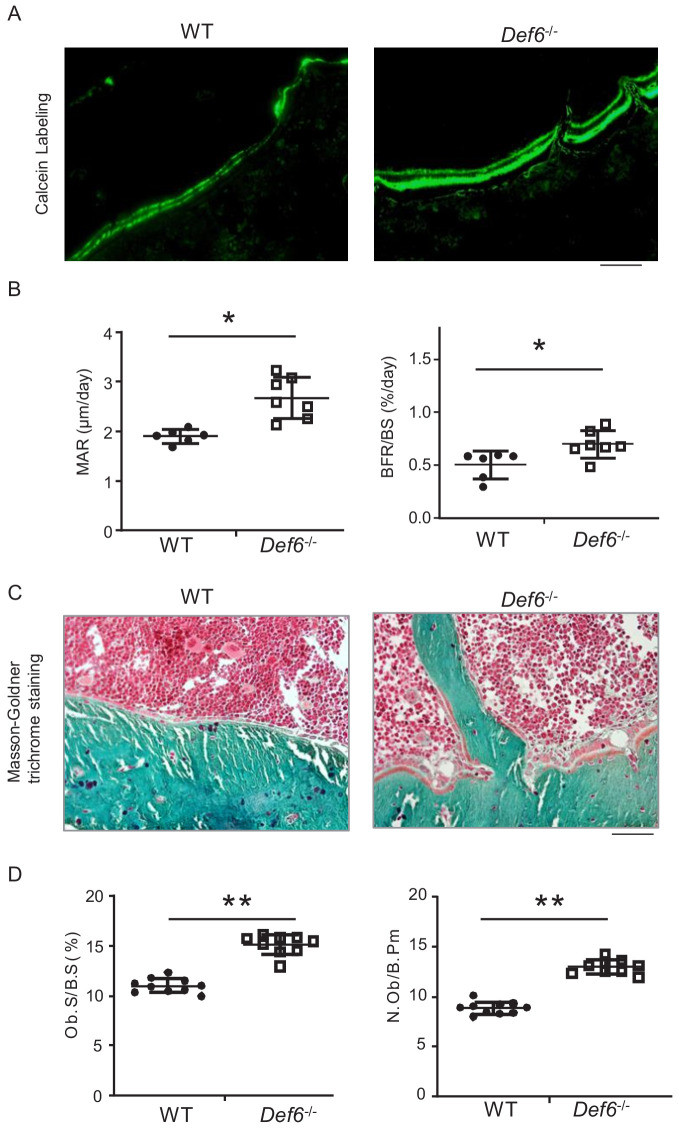
Figure 2. Def6 deficiency enhances osteogenesis in vivo.
(A) Images of calcein double labeling of the tibiae of WT and Def6-/- littermate mice. (B) Bone morphometric analysis of mineral apposition rate (MAR) and bone formation rate per bone surface (BFR/BS) after calcein double labeling of the tibiae of WT and Def6-/- littermate male mice. n = 6. (C) Images of Masson-Goldner staining of tibiae of WT and Def6-/- littermate mice. The bones show green, osteoid matrix appears dark orange on the surface of the bone beneath the osteoblasts, osteoblasts (Ob) are stained orange lining on the bone surface, and bone marrow cells appear red in the photograph. (D) Bone morphometric analysis of osteoblast surface per bone surface (Ob.S/BS) and osteoblast number per bone perimeter (N.Ob/B.Pm) of the tibiae of WT and Def6-/- littermate male mice. n = 8. Scale bars = 50 µm. Data are mean ± SEM. *p<0.05, **p<0.01. n.s., not statistically significant.


