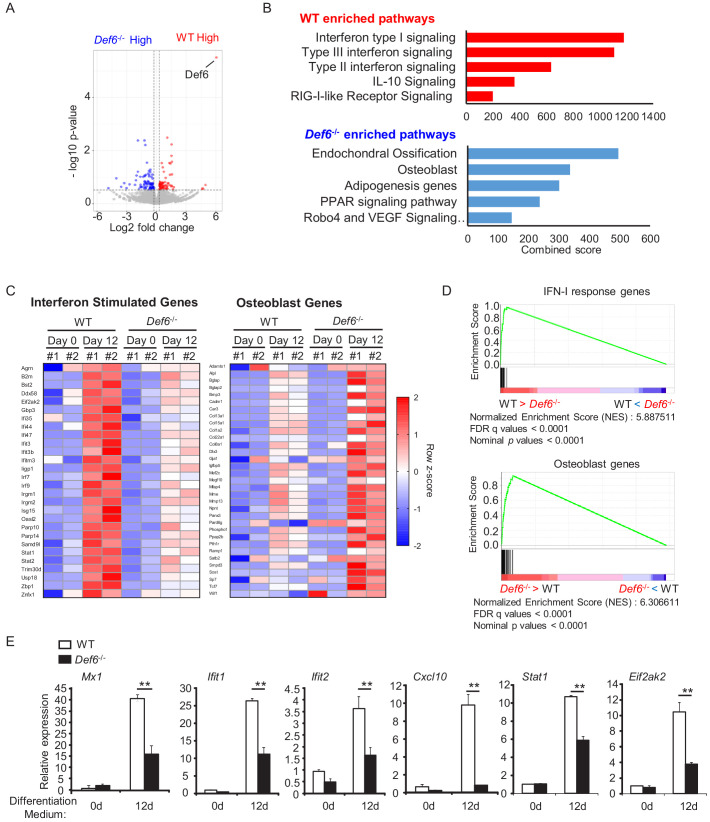
Figure 3. Def6 deficiency decreases the expression of interferon stimulated genes (ISGs), which are induced during osteoblast differentiation.
(A) Volcano plot of RNA-seq analysis of differentially expressed genes using the mRNAs isolated from the WT and Def6-/- calvarial osteoblast cells stimulated with osteogenic medium for 12 days. Blue dots show genes more highly expressed in Def6-/- osteoblasts than WT osteoblasts with significant (p<0.05) and greater than 1.2-fold changes. Red dots show genes more highly expressed in WT osteoblasts than Def6-/- osteoblasts with significant (p<0.05) and greater than 1.2-fold changes. (B) Pathway analysis of significantly differentially expressed genes. Upper panel shows enriched pathways in WT and lower panel shows enriched pathways in Def6-/- osteoblasts. (C) RNAseq–based expression heatmaps of the interferon stimulated genes (left panel) and osteoblast genes (right panel) regulated by Def6 deficiency based on the differentially expressed genes from (A). Row z-scores of CPMs of genes were shown in the heatmap. #1, replicate 1. #2, replicate 2. (D) Gene set enrichment analysis (GSEA) of differentially expressed genes from WT and Def6-/- calvarial osteoblast cells stimulated with osteogenic medium for 12 days ranked by NES scores. Type-I IFN response genes and osteoblast genes are mostly enriched in WT and Def6-/- osteoblast cells, respectively (p<0.0001 and FDR < 0.0001). The enrichment plots are shown. NES, normalized enrichment score. (E) qPCR analysis of type-I IFN response gene expression during osteoblast cell differentiation. Data are mean ± SEM. **p<0.01. n.s., not statistically significant.

