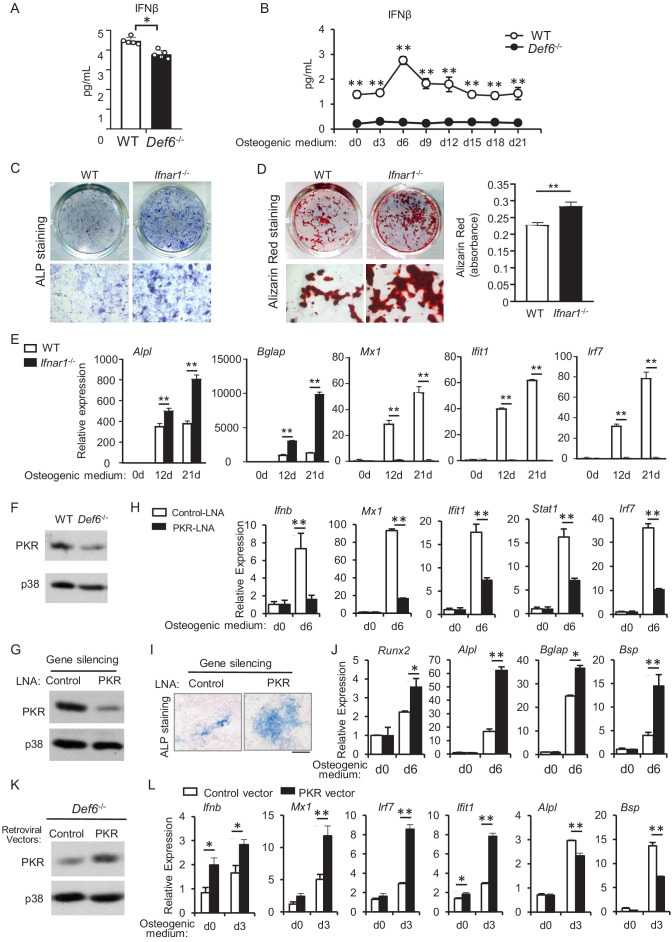
Figure 6. Def6 deficiency inhibits endogenous expression of IFN-β and ISG genes via downregulation of PKR in osteoblasts.
(A–B) ELISA analysis of IFN-β level in mouse serum (A) and in CD45 negative calvarial osteoblast cell cultures (B) from WT and Def6-/- mice (n = 5). (C) ALP staining at day 7 and (D) Alizarin red staining at day 21 (left panel) and its quantification (right panel) of WT and Ifnar1-/- (IFNαβR KO) calvarial osteoblast differentiation in osteogenic medium. (E) qPCR analysis of mRNA relative expression of osteoblast marker genes and ISGs during WT and Ifnar1-/- (IFNαβR KO) calvarial osteoblast differentiation process. (F) Immunoblot analysis of PKR expression in WT and Def6-/- calvarial osteoblasts. p38 was used as a loading control. (G) Immunoblot analysis of PKR expression after knockdown of PKR by PKR-LNA induced gene silencing in ST2 cells. p38 was used as a loading control. (H–J) qPCR analysis of mRNA expression of Ifnb and ISGs (H), ALP staining, scale bar: 500 µm (I) and qPCR analysis of mRNA expression of osteoblastic genes (J) in ST2 cells with or without PKR knockdown. (K) Immunoblot analysis of PKR expression after overexpression of PKR by retroviral transduction for 24 hr. p38 was used as a loading control. (L) qPCR analysis of mRNA expression of Ifnb, ISGs and osteoblast markers. Data are mean ± SD. *p<0.05. **p<0.01. n.s., not statistically significant.
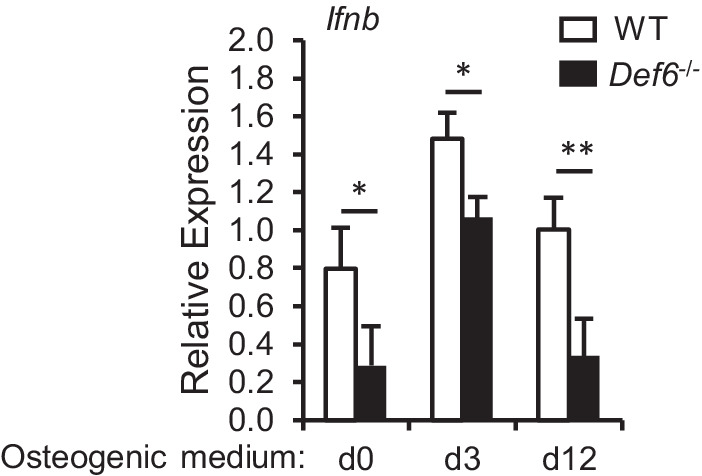
Figure 6—figure supplement 1. qPCR analysis of mRNA expression of Ifnb during osteoblast differentiation.

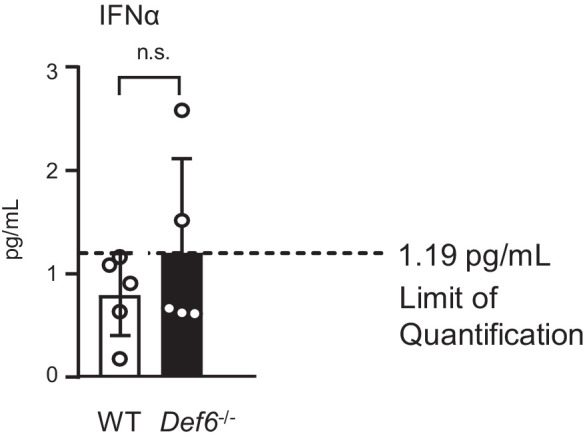
Figure 6—figure supplement 2. ELISA analysis of IFNα level in the serum of 8 week old WT and Def6-/- mice.


