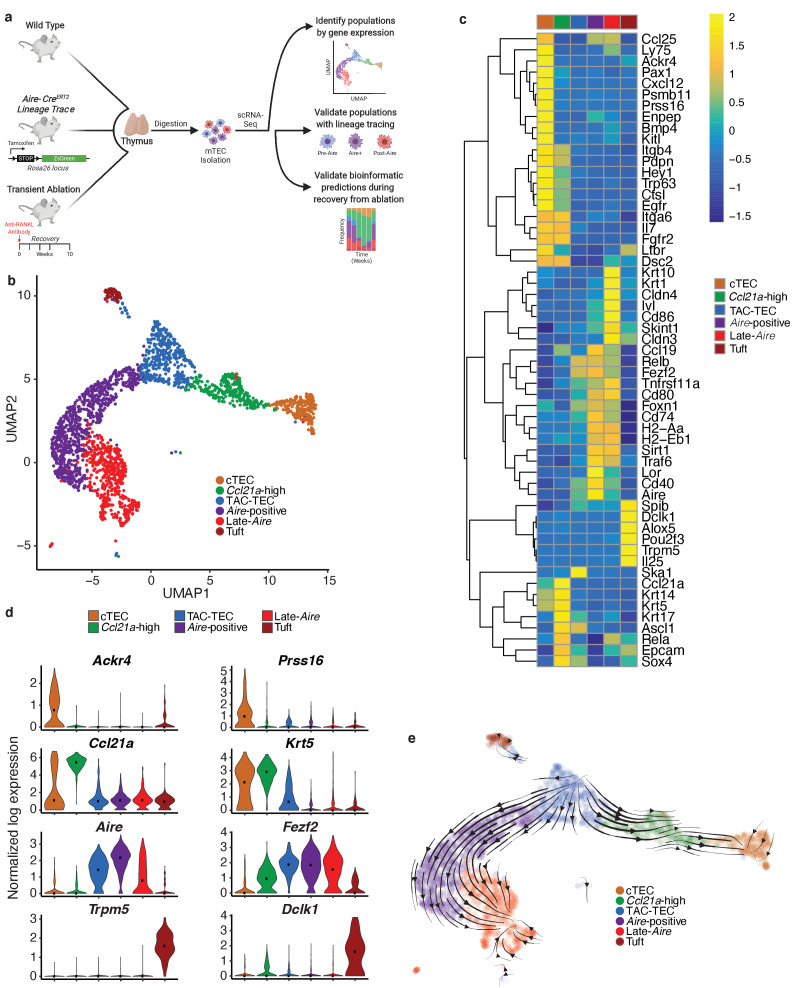
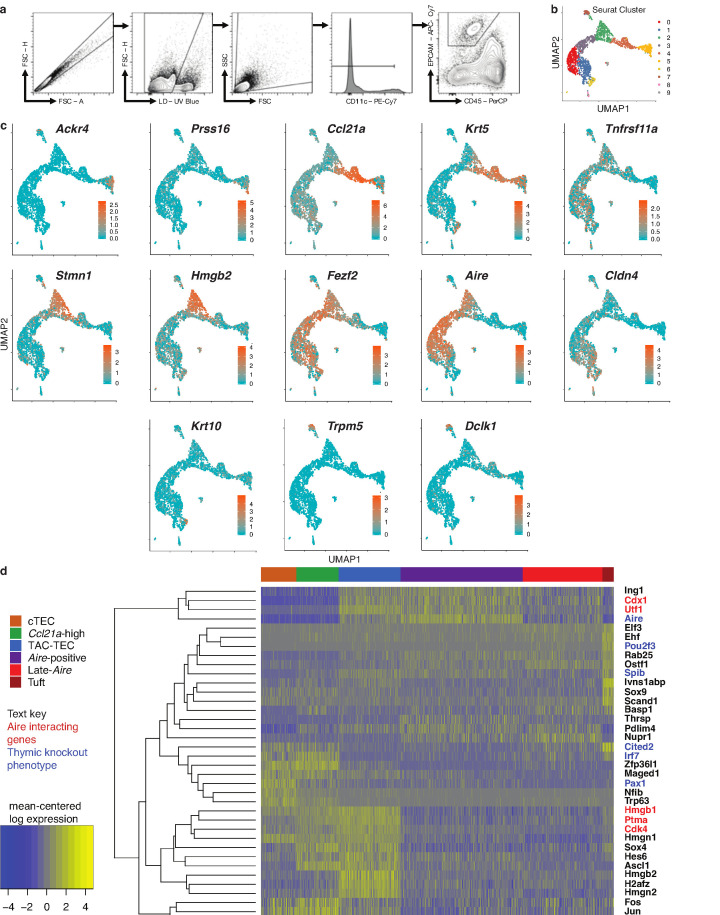
Figure 1. Single-cell sequencing of medullary thymic epithelial cells reveals population relationships.
(A) Outline of experimental design. Lineage relationships were first determined bionformatically from single-cell RNA-sequencing of control thymus. Lineage relationships and gene-expression events were then validated using both an inducible in vivo lineage tracing system and a model of transient thymus ablation and recovery. (B) UMAP visualization of all 2434 cells and clustering (color) of mTECs (two replicates, three pooled thymi each). Each point represents a cell. (C) Heatmap of genes curated from the literature across mTEC populations identified in this study. Color is mean-centered, log-normalized expression. Gene expression is the average expression within each mTEC population. (D) Normalized log expression of marker genes for known mTEC populations across cells in each cluster. Color represents cluster, black dot is median expression. (E) Single-cell velocity plot showing lineage relationships between mTECs projected onto a UMAP dimensional reduction. Arrows represent predicted developmental trajectories. See also Figure 1—figure supplement 1.


