. 2020 Nov 23;9:e60188. doi: 10.7554/eLife.60188

Figure 2. Characterization of TAC-TECs and developmental dynamics from this population.

(A) Summary dot plot of expression of genes differentially upregulated uniquely in the TAC-TEC population (adj-p-val<0.05 and log|fold change| > 2) across mTEC populations. Red text color represents genes previously associated with transit-amplifying cells, DE genes were enriched for transit-amplifying genes (p=1.44×10⁻³⁴). Color indicates average expression and size indicates percent of cells expressing the transcript. (B) Normalized log expression of selected cell-cycle genes, chromatin modifiers, and genes important for mTEC function. Colors represent cell-cycle state. (C) Flow-cytometric analysis of mTEC (AIRE and MHCII) vs a cell-cycle (KI67) markers (three pooled thymi per replicate, n = 5 replicates). Bar plots represent percentages of cells positive for Ki67 for each population (data are mean ±s.d. n = 5 mice). (D) Predicted pseudotime line (slingshot algorithm) depicting developmental trajectory exclusively for cells in the Aire branch. (E) Expression patterns of genes (log expression) and gene sets (average log expression) for cells in the Aire branch of development across pseudotime (see E). Color represents population. See also Figure 2—figure supplements 1 and 2.

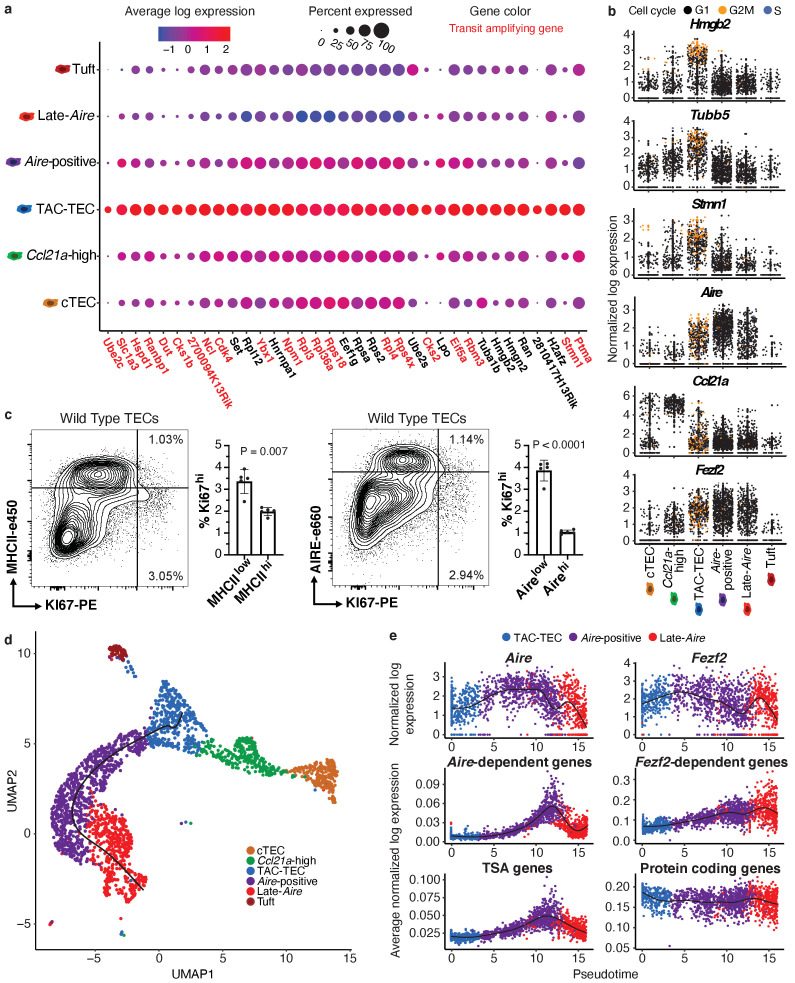
Figure 2.

Figure 2—figure supplement 1. Characterization of TAC-TEC Population.

Figure 2—figure supplement 1.

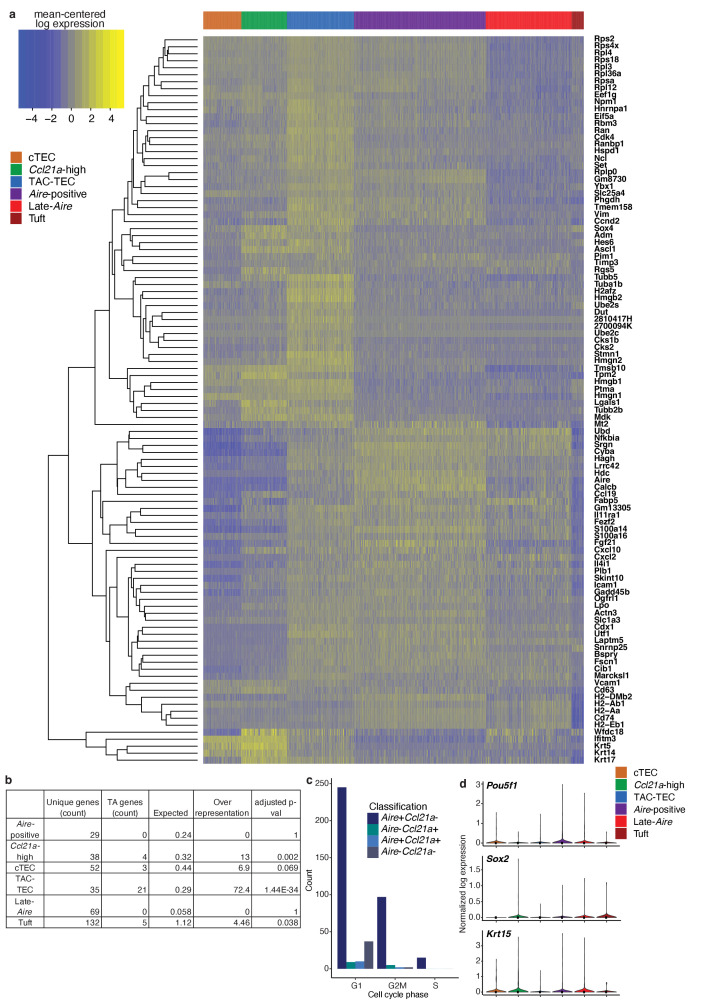
(A) Heatmap of all genes differentially upregulated in the TAC-TEC population compared to other populations (adj- p-val <0.05, and log fold change >2). High expression: yellow; low expression: blue. Cells organized by population, genes organized by hierarchical cluster. (B) Over representation of transit-amplifying genes in all identified mTEC populations. Adjusted p-value was calculated using a hypergeometric test. (C) Counts of cells expressing Aire and/or Ccl21a for each sample in the TAC-TEC population separated based on cell-cycle status. Color relates to which genes are expressed. (D) Normalized log expression of stem cell marker across cells in each cluster. Color represents cluster, black dot is median expression.
Figure 2—figure supplement 2. TSAs are expressed late in pseudotime.

Figure 2—figure supplement 2.

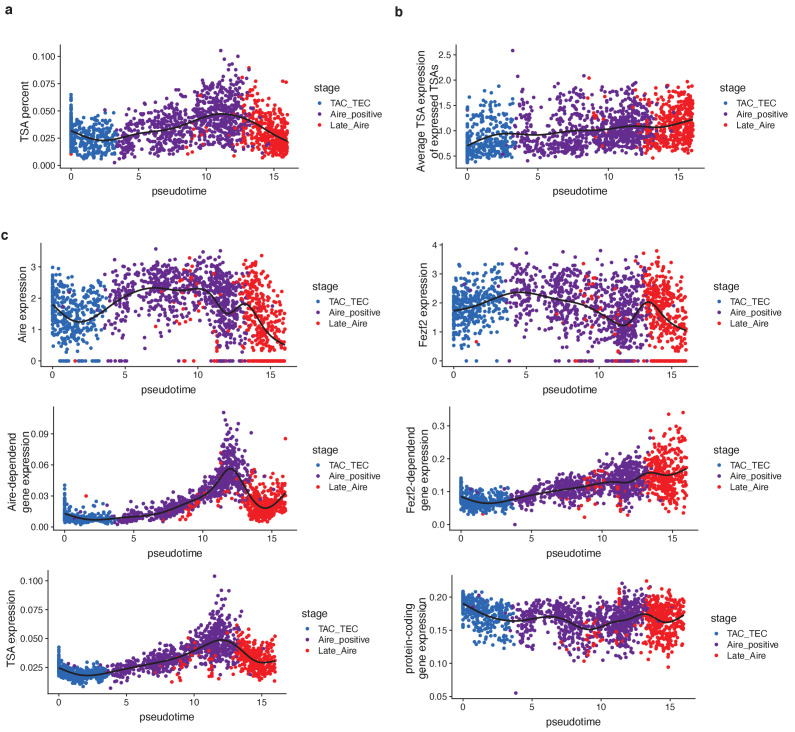
(A) The percent of TSAs expressed as a function of pseudotime (from Figure 2E). Color represents population. (B) The average expression of only expressed TSAs as a function of pseudotime (from Figure 2E). Color represents population. (C) Expression patterns of genes (log expression) and gene sets (average log expression) for cells in the Aire branch of development across psuedotime after the analysis was repeated without using TSAs in the list of ordering genes. Color represents population.