. 2020 Nov 23;9:e60188. doi: 10.7554/eLife.60188

Figure 4. Treatment with anti-RANK ligand decreases the relative size of the entire Aire-expressing mTEC population.

(A) Overview of the experimental protocol. Anti-RANKL was given over the course of a week, and thymi were sequenced at weeks 2, 4, 6, and 10 following treatment. Isotype control thymi were also sequenced at weeks 2 and 10. 3 thymi were pooled for all samples. (B) UMAP projections of all 8453 cells from all samples. Top: color represents original Aire trace identity (see Figure 1), gray represents all other samples. Bottom: color represents inferred population labels. Identity of cells in all samples was inferred from the original identity of Aire lineage tracing cells. (C) Proportions of cells in each population for each sample. Color is cell population. (D) Flow-cytometric analysis of the Ccl21a population at week four following treatment with anti-RANKL and an age-matched isotype control mouse (two pooled thymi per replicate, n = 4 replicates for treatment, n = 5 for controls). Plots show the proportion of all TECs in the CCL21 population and the absolute number of cells in the CCL21 population for the anti-RANKL treated and isotype control samples (data are mean ± s.d.). (E) Predicted pseudotime line (slingshot algorithm) depicting developmental trajectory for cells from all samples in exclusively the Aire branch. (F) Density plots of cells in the Aire branch of development across pseudotime (see E) for each sample. Color represents sample. See also Figure 4—figure supplements 1, 2 and 3.

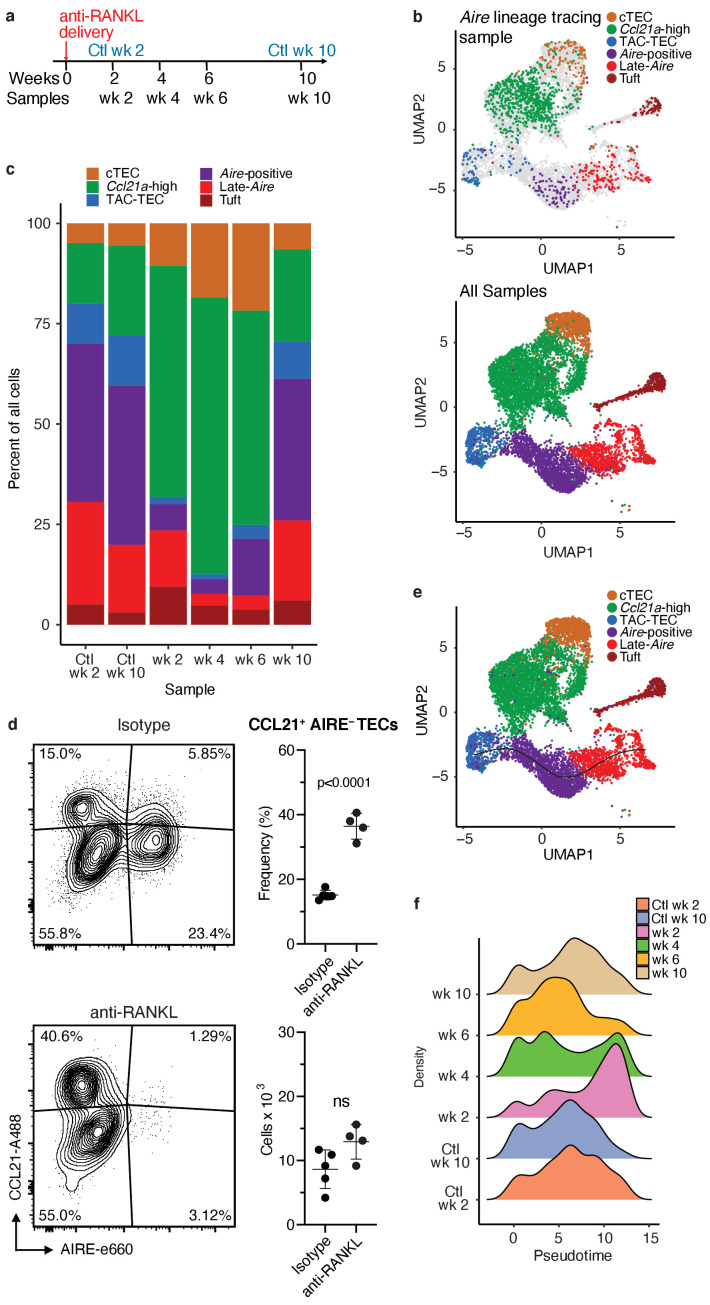
Figure 4.

Figure 4—figure supplement 1. Classification of cell populations following treatment with anti- RANKL.

Figure 4—figure supplement 1.

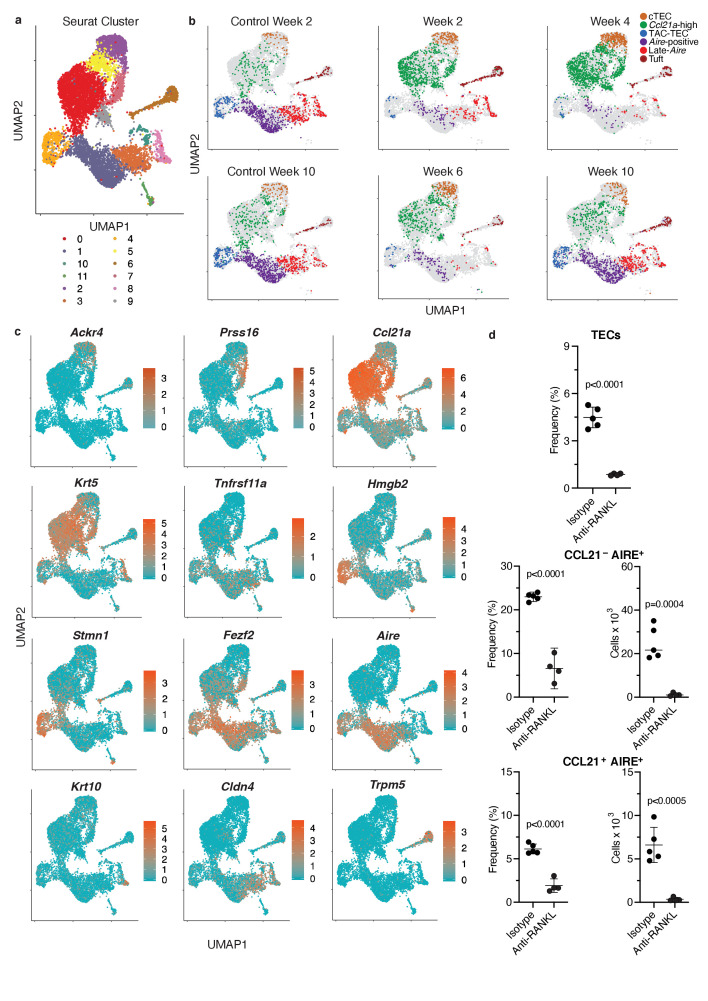
(A) UMAP dimensional reduction visualization all cells from all samples. Color represents Seurat cluster. Cluster 11 was t-cells and was removed. (B) UMAP dimensional reduction visualizations for each sample. Color represents population for the indicated sample. Each point represents a cell; gray points are all other samples. (C) UMAP dimensional reduction visualizations all samples. Color indicates normalized log expression of marker genes for mTEC populations. (D) Flow-cytometric analysis of KI67-expressing cells at week four following treatment with anti-RANKL and an age-matched isotype control mouse (two pooled thymi per replicate, n = 4 replicates for treatment, n = 5 for controls). Plots show absolute number of TECs, frequency and absolute number of CCL21-AIRE+ TECs, and frequency and absolute number of CCL21+AIRE+ TECs in anti- RANKL treated and isotype control samples (data are mean +/- sd).
Figure 4—figure supplement 2. Classification of cells following anti-RANKL treatment.

Figure 4—figure supplement 2.

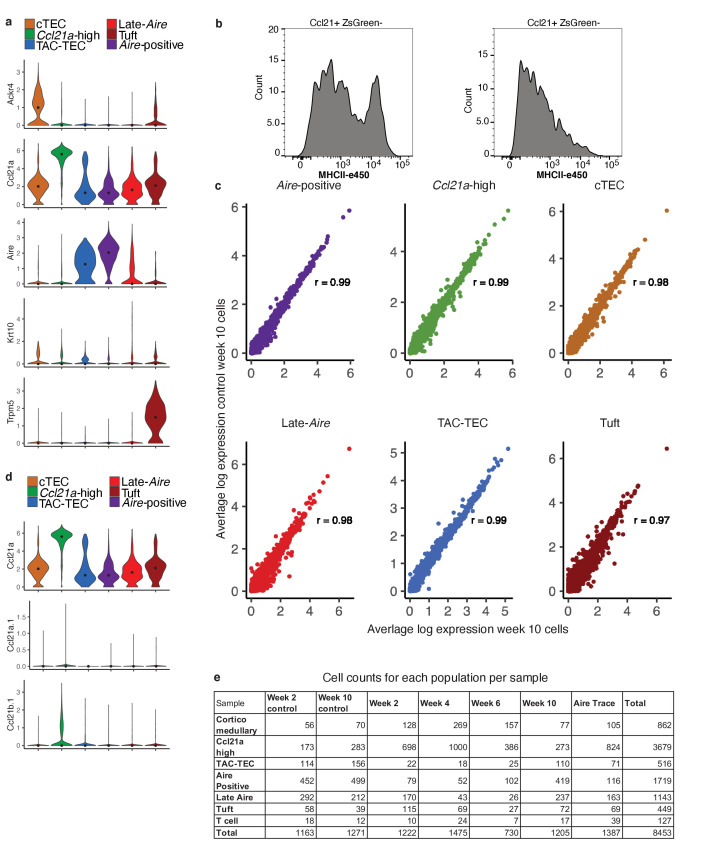
(A) Normalized log expression of marker genes for known mTEC populations across cells from all samples in each cluster. Color represents cluster, black dot is median expression. (B) MHCII surface expression within the CCL21+ZsGreen- gated population. (C) Correlation plots of the week 10 control vs. week-10 treatment within each mTEC population. Each point represents a gene. Average expression of each gene was computed across all cells within each population. Color indicates cluster. Pearson’s correlation is shown. D Normalized log expression of other Ccl21 genes (Ccl21b and Ccl21a.1, Ccl21a included for reference) across all samples. Color represents cluster, black dot is median expression. (E) The number of cells from each sample in each population.
Figure 4—figure supplement 3. Gene-expression patterns across experiments.

Figure 4—figure supplement 3.

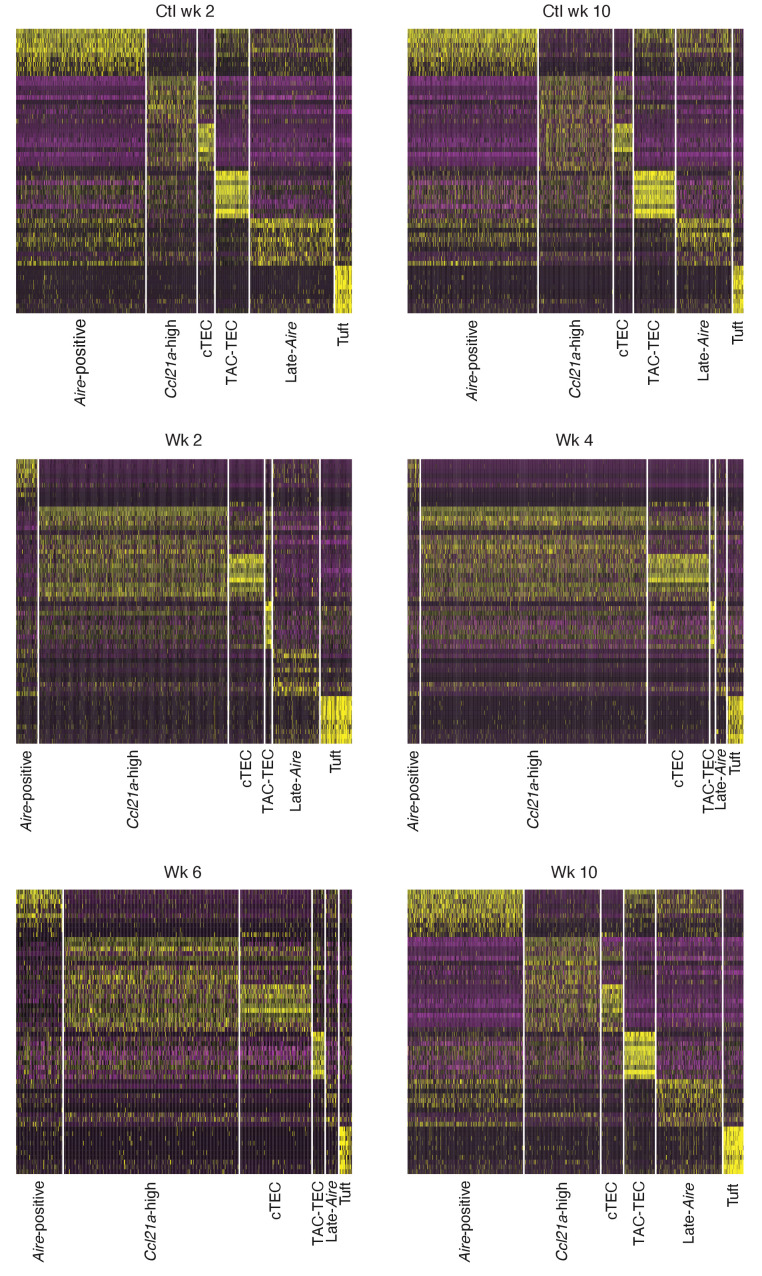
Heatmaps of expression patterns of marker genes of the control populations across all experiments. Gene lists (including gene order) are identical in each heatmap. The x axis represents cells separated by population, populations appear in the same order between heatmaps. Individual cells are colored based on expression level: purple: low expression; yellow: high expression.