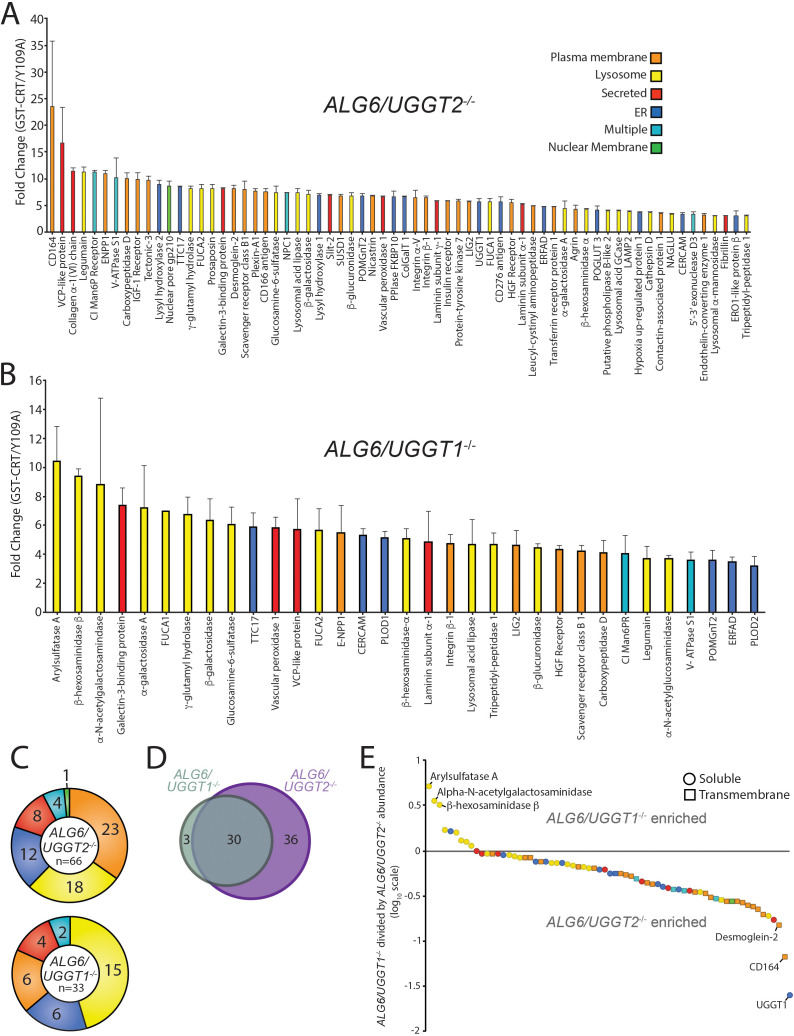
Figure 2. Identification of UDP-glucose:glycoprotein glucosyltransferase (UGGT)1- and UGGT2-specific substrates.
(A) Reglucosylation substrates in ALG6/UGGT2-/- cells were identified and quantified as previously described in Figure 1. Localizations as annotated by UniprotKB are depicted. Data are representative of two independent experiments. Error bars represent SEM. (B) Reglucosylated substrates in ALG6/UGGT1-/- cells were identified and quantified as previously above. (C) The distribution of localizations as annotated by UniprotKB for reglucosylation substrates identified in both ALG6/UGGT2-/- and ALG6/UGGT1-/- cells is depicted. (D) The overlap of reglucosylated substrates identified in both ALG6/UGGT2-/- cells (purple) and ALG6/UGGT1-/- cells (gray) is visualized by a Venn diagram. (E) Reglucosylated substrate enrichment in either ALG6/UGGT1-/- or ALG6/UGGT2-/- cells is depicted by dividing the tandem mass tag quantification for each protein in ALG6/UGGT1-/- cells by the associated value in ALG6/UGGT2-/- cells on a log10 scale. Positive and negative values represent enrichment in ALG6/UGGT1-/- and ALG6/UGGT2-/- cells, respectively. Localization (coloring) and topology (soluble [circles] or transmembrane [squares]) are depicted based on UniprotKB annotation.


