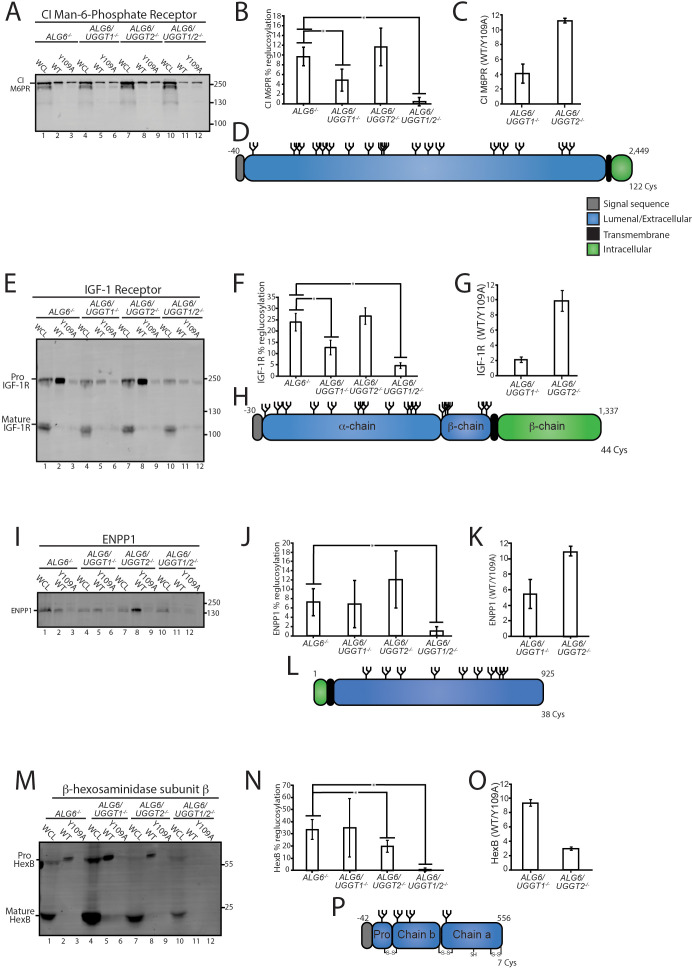
Figure 3. Validation of select reglucosylation substrates.
(A) The designated cell lines were lysed and split into whole cell lysate (WCL, 10%) or affinity purification by GST-CRT-WT or GST-CRT-Y109A and imaged by immunoblotting against the CI Man-6-Phosphate receptor. Data is representative of three independent experiments with quantification shown in panel (B). Quantifications were calculated by subtracting the value of protein in the Y109A lane from the value of protein in the associated wild-type (WT) lane, divided by the value of protein in the associated WCL lane and multiplied by 100. Error bars represent the standard deviation. Asterisks denote a p-value of less than 0.05. (C) Tandem mass tag (TMT) mass spectrometry quantification of CI Man-6-Phosphate receptor reglucosylation from ALG6/UGGT1-/- cells (Figure 2B) and ALG6/UGGT2-/- cells (Figure 2A). (D) Cartoon representation of CI Man-6-Phosphate receptor with N-glycans (branched structures), the signal sequence (gray), luminal/extracellular domain (blue), transmembrane domain (black), and intracellular domain (green) depicted. Number of amino acids and Cys residues are indicated. (E) Reglucosylation of IGF-1R, conducted as previously described above. Pro IGF-1R and mature IGF-1R are both observed due to proteolytic processing. Data are representative of three independent experiments with quantification displayed in (F). (G) TMT mass spectrometry quantification of IGF-1R from Figure 2A and B, as previously described. (H) Cartoon depiction of IGF-1R. (I) The reglucosylation of ENPP1 shown with quantification displayed in J. (K) TMT mass spectrometry quantification of ENPP1 from Figure 2A and B with cartoon depiction of ENPP1 in L. (M) Reglucosylation of β-hexosaminidase subunit β, conducted as previously described with quantifications displayed in N and TMT mass spectrometry quantification of β-hexosaminidase subunit β from Figure 2A and B in O with a cartoon depicting β-hexosaminidase subunit β in P.


