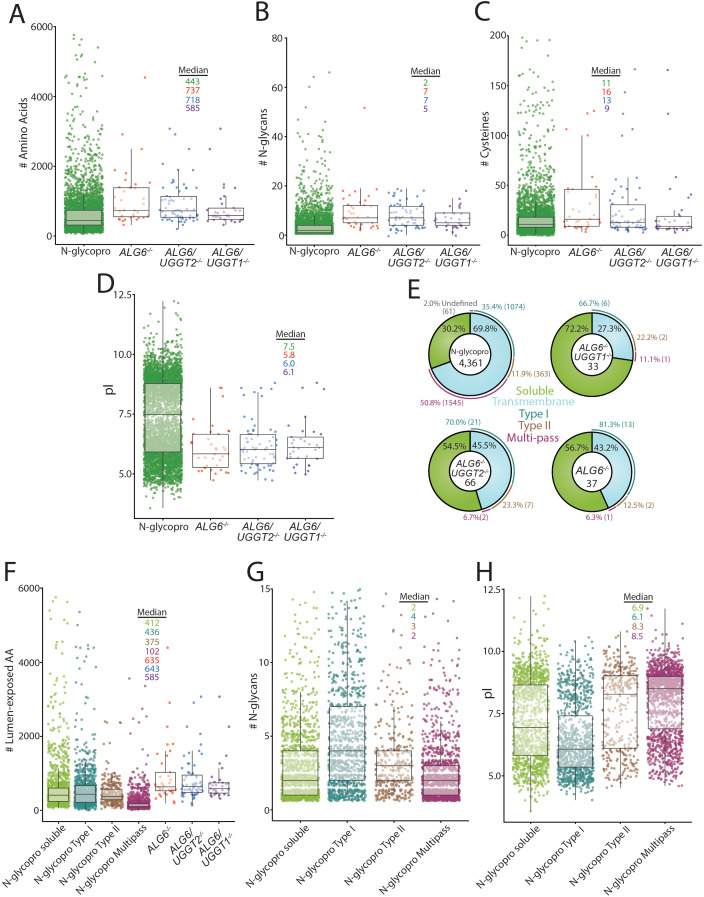
Figure 4. Analysis of substrates of the UDP-glucose:glycoprotein glucosyltransferase (UGGT)s and the N-glycoproteome.
(A) Amino acid lengths of each protein in the indicated data sets were visualized by scatter plot overlaid with a box and whisker plot. Amino acid number was obtained via UniprotKB. All scatter plots with box and whisker plots were generated using R and the ggplot package. The number of N-glycans (B) or Cys residues (C) for each protein in the indicated data sets was visualized by scatter plot overlaid with a box and whisker plot with the numbers determined using their UniprotKB annotation. (D) The isoelectric point (pI) values for each protein in the indicated data sets was visualized by scatter plot overlaid with a box and whisker plot. The pI values were obtained via ExPASy theoretical pI prediction. (E) The computationally predicted N-glycoproteome and the indicated reglucosylation substrates were determined as either soluble or transmembrane using UniprotKB annotations. The transmembrane portion of each data set was then analyzed for type I, type II, or multi-pass topology using the associated UniprotKB annotation. Proteins that were annotated by UniprotKB as transmembrane but lacked topology information were labeled as undefined. (F) The computationally determined N-glycoproteome was separated into soluble, type I, type II, and multi-pass transmembrane proteins using UniprotKB annotations. Luminally exposed amino acids were computationally determined using UniprotKB annotations for each subset of the N-glycoproteome and each indicated reglucosylation substrate data set. The resulting data was visualized by scatter plot overlaid with a box and whisker plot. (G) The indicated N-glycoproteome subsets were analyzed for N-glycan content using UniprotKB annotation and visualized by scatter plot overlaid with a box and whisker plot, as described. (H) The indicated N-glycoproteome subsets were analyzed for predicted pI using ExPASy theoretical pI prediction and visualized by scatter plot overlaid with a box and whisker plot.

