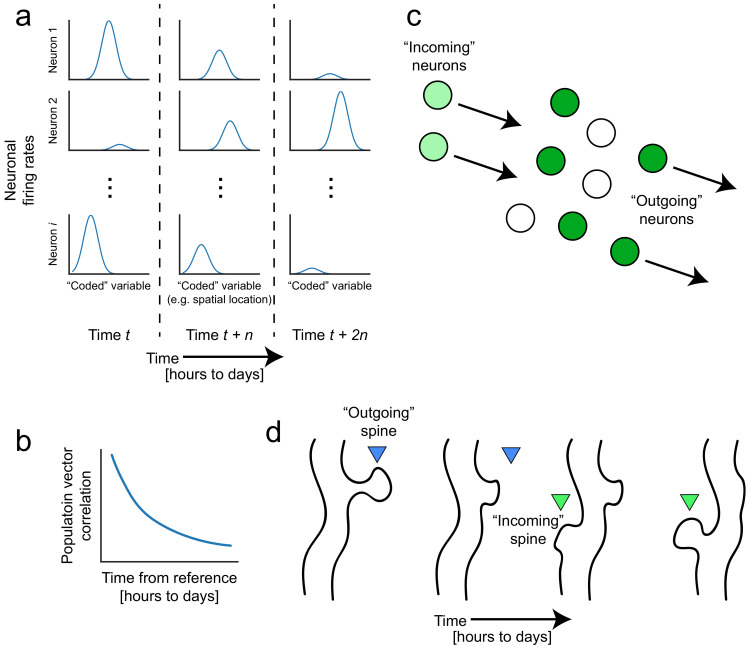
Figure 1. Representational drift and intrinsic dynamics supply neural substrates for memory-updating over time.
(a) Example tuning curves of a neuronal population changing its firing patterns over time with respect to an arbitrary external variable (e.g. spatial location) (Mau et al., 2018; Ziv et al., 2013). Each column corresponds to a certain point in time. Some neurons will lose their field while others gain one. This occurs even when the animal is performing stereotyped behavior (Chambers and Rumpel, 2017; Rokni et al., 2007; Rule et al., 2019). (b) Schematic of population similarity over time. As a result of (a), the similarity of population activity to time t decreases over time (Mankin et al., 2012; Mau et al., 2018; Ziv et al., 2013). (c) Schematic of fluidity in ensembles. Intrinsic fluctuations that result in increased excitability in certain neurons (light green circles) bring them up to par with the currently active ensemble (dark green circles) relative to non-active ensembles (white circles). These ‘incoming’ neurons become more likely to encode future memories (Rogerson et al., 2014). At the same time, other ‘outgoing’ neurons lose their association with the network or their synapses are pruned to make room for the incoming cells. (d) Schematic of dynamic synapses. Even in the absence of neuronal activity, synapses are known to be continuously formed and eliminated (Minerbi et al., 2009; Yasumatsu et al., 2008), meaning this is an intrinsic process that occurs regardless of input. Perhaps the underlying source of drift at the population level is intrinsic synaptic volatility (Holtmaat and Svoboda, 2009; Ziv and Brenner, 2018).

