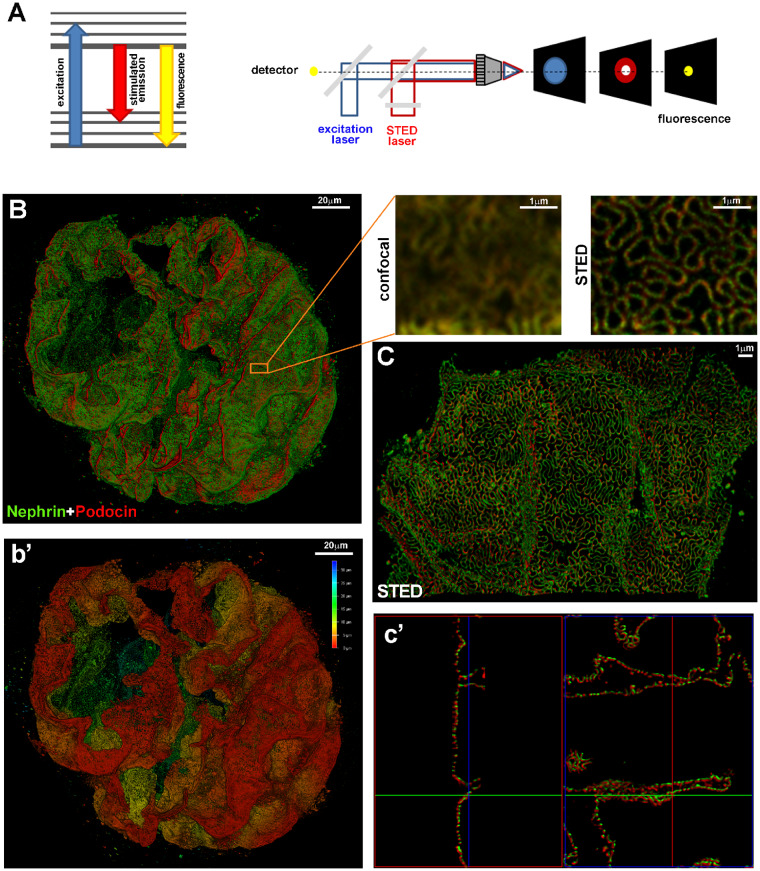
FIGURE 2.
(A) The Jablonski diagram (left) shows the process of stimulated emission in STED microscopy. In normal fluorescence, a fluorophore can absorb a photon from the excitation light (blue arrow) and jump from the ground state to the excited state. Spontaneous fluorescence emission (with longer wavelength) (yellow arrow) brings the fluorophore back to the ground state. Stimulated emission of the excited molecules (red arrow) causes the emitted light to be of sufficiently longer wavelength and shorter fluorescent lifetime so that it can be separated from normal fluorescence. Schematic drawing (right) of a STED microscope: the excitation laser (blue) and STED laser (red) are focused into the sample through the objective. A phase mask is placed in the light path of the STED laser to create a specific doughnut-shaped pattern at the objective focal point. With this configuration, a diffraction-limited spot is excited (blue spot) while a superimposed, red-shifted STED laser with a doughnut shape (red spot) depletes all emission laterally, leaving only a central focal spot with a dimension less than the diffraction limit (yellow spot). Only emitted photons from the centre of the doughnut are collected. (B) A z-stack and 3D rendering of a glomerulus in a cleared tick slice (500 μm thick) of kidney tissue acquired with confocal microscopy. The optical transparency and antibody penetration depth were sufficient for imaging thick samples with confocal microscopy, enabling a global view of protein expression in the whole glomerulus. Magnifications of the boxed area show the comparison between confocal and STED acquisitions. The sample was stained for nephrin (green) and podocin (red). Localization of podocin and nephrin can clearly be resolved at the nanometre scale with super-resolution STED imaging. (b’) Depth coding profile of the same glomerulus in (B). (C) Volumetric representation of a 3D STED z-stack. The combination of optical clearing, immunostaining and higher-resolution imaging permitted visualization of the spatial distribution of proteins in the slit diaphragm (in c’, 3D projections of C). All images were deconvolved with SVI Huygens software. STED and confocal images were acquired with a Leica TCS SP8 STED 3X.

